transactions
Housing transactions have hit a plateau, with little prospect of recovering to anything close to 2007 levels. However, these headline figures mask shifting trends about buyer types and where they’re buying
.png)
Housing transactions have hit a plateau, with little prospect of recovering to anything close to 2007 levels. However, these headline figures mask shifting trends about buyer types and where they’re buying
London and, to a lesser degree, the rest of the South, have continued to push up against mortgaged constraints at a time of fragile buyer sentiment. Across London, transaction numbers in the year to June 2018 were 6.2% lower than the year before and stood at only half of 2007 levels.
Growth has continued elsewhere in the country, especially in areas where affordability is less constrained and buyer confidence is higher.
.png)
Shifting patterns of different buyer types also reveal more about how the market is now operating. Contrary to what we are sometimes asked to believe, the number of first-time buyer transactions has rocketed in the past five years.
In the year to July 2018, they stood at 364,800 – some 52% higher than five years ago and up by 3% in just one year.
Though take-up of Help to Buy has grown by an average of 22% per annum over the past three years, that’s not the only contributing factor to this trend.
The ‘bank of Mum and Dad’ has had a much greater impact. That’s not going to change any time soon, either, as any expansion of Help to Buy beyond 2021 is currently expected to be for a limited period and in a more targeted form.
Looking into the future, loan-to-income limits are also likely to act as a barrier to expansion. The average currently stands at a ratio of 1:3.69, having grown steadily since 2009, with more joint-income households taking mortgages at higher loan-to-income ratios. As banks become less willing to lend at ratios over four, there is only limited room for first-time buyers to stretch themselves as interest rates rise.
This is especially true in London, where first-time buyer transactions have already declined. After peaking in Q3 2014, they have fallen by 15%. In the capital, loan-to-income ratios simply haven’t been able to keep pace with price growth, leaving barriers to home ownership undiminished.
By contrast, in the South East, transaction levels have risen by 15% in the same period, fuelled, in part, by a migration of buyers into areas of greater affordability.
Highly geared buy to let investors are rationalising their portfolios and refocusing on lower-value, higher-yielding locations
Savills Research
The number of home movers has been largely flat since 2014. Owners now trade up the housing ladder far less often. Our research earlier this year found the average period between moves grew from nine years in 2007 to 13.5 years in 2017.
With tighter mortgage regulation, homeowners in lower-growth parts of the UK have struggled to accumulate enough equity to trade up the ladder. And where house prices have grown fastest, households struggle to raise sufficient mortgage debt to finance their move.
We see no reason for these trends to change significantly in light of our house-price forecasts. Therefore, we expect the number of homemovers to be largely static over the course of the five-year forecast period.
In the longer term, as with first-time buyers, homeowners’ ability to trade up will increasingly depend on either a change in their personal finances or an injection of equity from older generations.
.png)
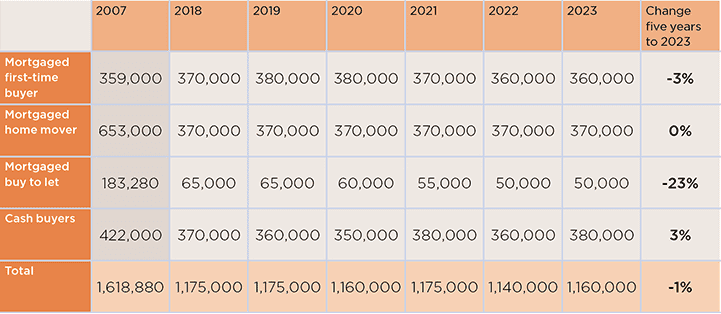
The mortgaged buy to let market faces significant challenges. These purchases have fallen by 43% in the past two years, with evidence that highly geared investors are rationalising their portfolios and refocusing on lower-value, higher-yielding locations.
The stamp duty hit of 2016 continues to depress appetite in the market, while restrictions on mortgage-interest tax relief are likely to result in even greater pressure on this part of the market. We expect these transactions to fall to around 50,000 by 2022, as those who remain in the market are required to supplement mortgage debt with more equity of their own.

Transactions per buyer type The mortgaged buy to let sector faces significant challenges
Source: Savills Research
Cash buyers currently account for about 31% of the market. Though that figure has fallen a little since 2014, these buyers still represent a much bigger proportion of the market than was the case before the credit crunch.
Given evidence of the number of purchasers who are bearing the 3% stamp duty surcharge, these buyers are now a particularly important component of investment demand, with a strong competitive advantage over those needing a mortgage.
With downsizers also adding to their number, these purchasers are often discretionary buyers. Some will wait until the political uncertainty of the next few years is resolved before they commit to buying.
So, we expect their levels to dip before bouncing after the general election. In the longer term, their activity will be influenced by the development of the retirement housing sector – which remains one of the biggest opportunities still untapped in UK housing.
5 other article(s) in this publication