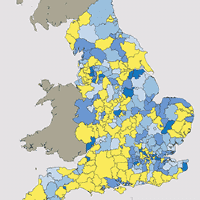
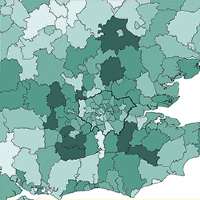
London’s assessed housing need could double to more than 100,000 per year under a new system for working out housing requirements. Supply at this level is required to improve affordability. More emphasis on ‘homes in the right places’, a key plank from the Housing White Paper, could mean big increases in housing requirements in London and its commuter belt, well above existing targets and levels of delivery in many locations.
A new approach
The Housing White Paper promises a new standardised approach to calculating housing need. It must add up to a high-enough figure to meet existing need, make up the backlog, and make a meaningful improvement to affordability. This should be at least 300,000 homes per year, in line with a growing academic and expert consensus. The White Paper suggests a more modest 225,000–275,000, but this only covers population growth and it will have no impact on housing affordability.
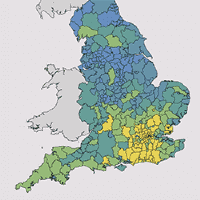
We await the promised consultation on the new method with great interest. In the meantime, we have proposed a simple approach that applies an increase to each district’s projected household growth based on local housing affordability (see the table below). The uplifts were chosen so that the national figure adds up to 300,000 homes per year.
Local planning authorities should propose higher numbers than those derived from this approach where they are needed to support ambitious economic growth plans.
.jpg)
.png)