Research article

Plan-making in numbers

It has been five years since the publication of the NPPF, and plan-making remains slow

This is the fifth annual Savills planning report and, yet again, it is produced during a time of political uncertainty, this time due to a snap UK election.

Housing has now moved up the political agenda, although there have been no calls to tear up the current plan-led system: but is it working as intended? The 2017 Housing White Paper declared the housing market broken. We investigate the plan-making process and delivery of housing since the introduction of the NPPF, as well as look forward to see how the White Paper could make an impact, with a particular focus on how planning interacts with the housing market.

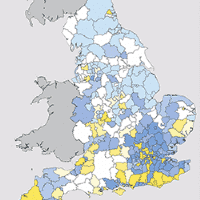
Figure 1

FIGURE 1Plan-making delivery – The early 2017 deadline has passed and just 41% of local authorities in England have adopted a post-NPPF plan

Source: Savills Research, April 2017

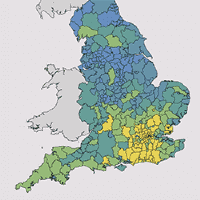
Figure 2

FIGURE 2Five-year land supply – 61 local authorities have had a lack of five-year land supply confirmed at appeal in the year to April 2017

Source: Savills Research, April 2017. *Note: Please see bottom of page for the methodology used to create the data above

*Methodology

We have applied a simple five-year land supply calculation to all local authorities in England using the LPA published supply figures. No adjustment has been made to the supply and the methodology does not impose any different treatment of the basic requirement other than it being annualised (spread over the relevant plan period).

The maps indicate categories based on the result, which allows a like-for-like comparison between authorities and echoes the arguments being used in appeals based on five-year land supply across the country.

Our calculation works as follows:

1) Current five-year requirement (taking the first available data source from the following list): a) Post-NPPF local plan target (where local plan adopted post March 2012; b) SHMA figure (midpoint if a range) (where published after March 2012).

2) Apply buffer (5% or 20% depending on authority statement) to requirement, we have assumed 20% where unclear or not stated.

3) Then calculate five-year supply based on these figures (based on LPA quoted land availability – from SHLAA and/or AMR). We are not questioning deliverability of the stated land supply in this exercise.

Other articles within this publication

3 other article(s) in this publication