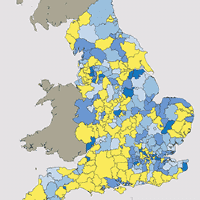
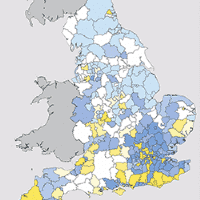
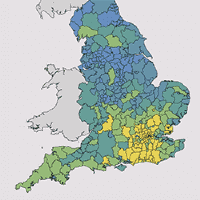
We have assessed each local authority on their post-NPPF local plan status, five-year land supply, and how they perform on the Housing Delivery Test outlined in the Housing White Paper. We have weighted the results using housing affordability in each local authority as an indication of housing demand. All of the 10 poorest-performing authorities cannot demonstrate a five-year land supply, have a housing affordability ratio greater than the national average, and only one has a post-NPPF local plan in place. Equally, they are often constrained by the Green Belt, posing an additional challenge to site identification.
Addressing the housing need
The most acute housing need is in London, and nine of the 10 poorest-performing local authorities are in the London commuter belt. Our index treats the London Plan as a post-NPPF plan, but without that, five London boroughs would be in the 10 poorest-performing local authorities.
There is great pressure to allocate land in these areas, but there is often strong local opposition to development. Local housing need and London overspill must be accommodated somewhere, and there are three main options for increasing supply:
■ A comprehensive review of density policies, particularly in London, including big increases in the number of homes planned near transport hubs.
■ Local authorities could release land through the Green Belt review process, including Green Belt ‘swaps’.
■ Local authorities could work in partnership – through the duty to cooperate – to allocate land to accommodate their housing need in less constrained markets. This approach would require a greater level of strategic planning, and investment in infrastructure to ensure new housing is connected to areas of unmet need.
In reality, a combination of all of these approaches would have the biggest impact.
.jpg)
.jpg)