
Stamp duty has been blamed for a cooling in the prime housing markets ever since the changes were announced in December 2014. Is there a chance of a cut to bring fresh market vigour?
First, how did the market arrive at this position?
In December 2014, the government scrapped the old structure of stamp duty land tax (SDLT) and introduced a new banding system. The changes were largely considered a political move, coming prior to a general election and at a time when the opposition was advocating a mansion tax.

FIGURE 1
What effect did this taxation have on prime property prices?
Even before December 2014, successive increases in stamp duty had substantially increased the tax burden at the top end of the market and made prospective buyers more cautious. In the 2013-14 tax year (before the stamp duty overhaul), sales of homes worth more than £1 million accounted for just 1.4% of all transactions and 13% of their aggregate value. Yet they accounted for more than a quarter of all stamp duty receipts – contributing £1.9 billion to the Treasury. In the following tax year, that sum went up to £2.2 billion, reflecting higher transactions in the first nine months before rates increased again in the 2014 Autumn Statement.
Surely the tax take from the top end had to fall in 2015-16?
Contrary to many people’s expectations, sales of property worth more than £1million went up again. Stamp duty receipts from this part of the market rose by 18%. In part, this reflected a surge in transactions in March 2016, as investors and second-home buyers brought forward their decision to buy in order to avoid yet more tax in the form of the 3% surcharge on additional homes. But still, this increase in tax take from the top end of the market dashed hopes of an early cut in stamp duty.
Following the rush of transactions to beat the 3% surcharge, have prime sales since dropped?
Figures for the year to 5 April 2016 remain the most up-to-date official figures for stamp duty receipts at the top end of the market. There have been reports suggesting receipts from prime property have subsequently fallen as a result of the tax rises. However, no one has been able to prove conclusively that the tax take is down. This reflects a lack of reliable, up-to-date information and the difficulties in adjusting for the March 2016 surge.
Meanwhile, stamp duty receipts across the housing market as a whole (reported by HMRC on a quarterly basis) continue to rise, having been boosted by higher than expected revenues from the additional 3%.
What is the Treasury’s view on reducing higher-rate SDLT?
Prior to the 2017 spring budget, Chancellor Philip Hammond said he needed to see more evidence of any negative impact of the high rates of duty before making a change. He will be particularly vigilant given the extent to which SDLT revenues have become dependent on the top end of the market. Much is at stake, with the Office for Budgetary Responsibility forecasting a 57% (or £4.8 billion) increase in total residential SDLT receipts between 2016-17 and 2021-22.
Is there a strong argument to reduce SDLT rates at the top end of the market?
Currently, data which the Treasury makes available shows that sales of property worth more than £500,000 fell back a little over the last quarter of 2016 – as they have done across the market as a whole. Frustratingly, there is no breakdown for higher price bands. Using the available data, it looks as if receipts from property worth more than £1 million in the second half of 2016 are likely to be down on the same period in 2015, but are less likely to be below those in 2014. So, any case to have underlying stamp duty rates reduced at the top end of the market will have to be supported by evidence of the knock-on consequences, possibly unintended, of the tax. The strength of this argument will become clearer as the effects on prices, transactions, housing delivery and the wider economy are better established.
So, the verdict is…
However highly taxed the top end of the market is, and whatever the undoubted economic inefficiencies this creates, a rate cut in the short term remains only a possibility rather than a probability.
To buy or rent?
Stamp duty has contributed to a weakening of buyers’ appetites and a lower transaction market, where renting looks comparatively more attractive for occupiers and where investors will take longer to recover their costs of acquisition.
We have looked at the cost of stamp duty for different property values compared to the number of days’ rent this equates to for both occupiers and investors.
For a buyer of a £2 million property, the stamp duty costs of more than £150,000 equals 935 days’ rent – two and a half years’ worth. For an investor buying a property of the same value, they would need to put aside 1,300 days rental income to cover their stamp duty bill.
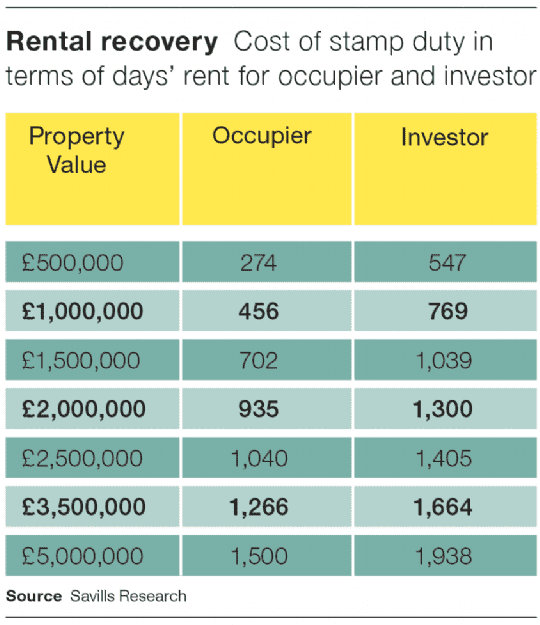
FIGURE 2Rental recovery: Cost of Stamp Duty in terms of days rent for occupier and investor
.png)
.png)
.png)
.jpg)
.png)
.jpg)
.jpg)
.jpg)