
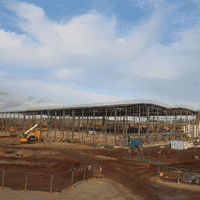
▲ Worcester Six, developed by Stoford
Another resolute performance across the West Midlands and with the supply remaining tight we anticipate a similar performance in 2018

Supply
■ The availability of warehouse units over 100,000 sq ft reached a critical low in Q3 2016 when supply stood at just 2.21m sq ft. Given the fact that the West Midlands has the highest amount of occupier demand of any region in the UK, developers have responded accordingly and current supply is 4.15m sq ft across 26 separate units.
■ The proportion of Grade A units on the market has increased in line with demand and now stands at 2.50m sq ft, accounting for 57% of all supply, up from just 16% of supply two years ago.
■ Given that the average size deal in 2017 was 277,000 sq ft there remains an imbalance in supply by size range. There are just five units on the market over 200,000 sq ft, accounting for 19% of supply, and just two units over 300,000 sq ft.
.png)
FIGURE 9Supply by size
Source: Savills Research
Take-up
■ Another fantastic year for occupier demand in the region saw the West Midlands eclipse the East Midlands for the first time as the long-term average take-up level now stands at 4.22m sq ft compared to 4.02m sq ft in the East.
■ In the most part this can be attributed to the fact that, unlike the national market, the level of build to suit in the region increased in 2017.
■ Of the 5.86m sq ft transacted over 2017 45% was classified as build to suit, compared to the long-term average of 32%. This was helped by key deals to Meggit in Coventry who committed to 440,000 sq ft (subject to planning) and Kimal in Worcester who took 140,000 sq ft in July.
■ Given the supply dynamics in the market it is encouraging that the level of take-up for speculative buildings has increased. For 2017 the figure rose to 19% of all transactions, up from 16% in 2016.
.png)
FIGURE 10Take-up
Source: Savills Research
Development Pipeline
■ Savills is currently tracking five units through the development pipeline which total 0.65m sq ft. All are sub 200,000 sq ft and the average size is 129,000 sq ft.
■ We expect both the amount of units under construction, and the average size unit, to increase into 2018 as more speculative announcements are made.
.png)
FIGURE 11Development pipeline by size
Source: Savills Research
.png)
TABLE 3Key stats
.png)

.png)
.png)
.png)
.png)
.png)
.png)