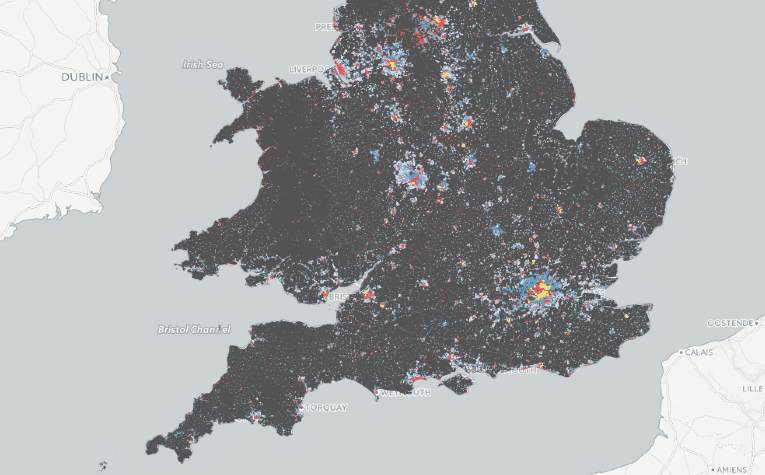
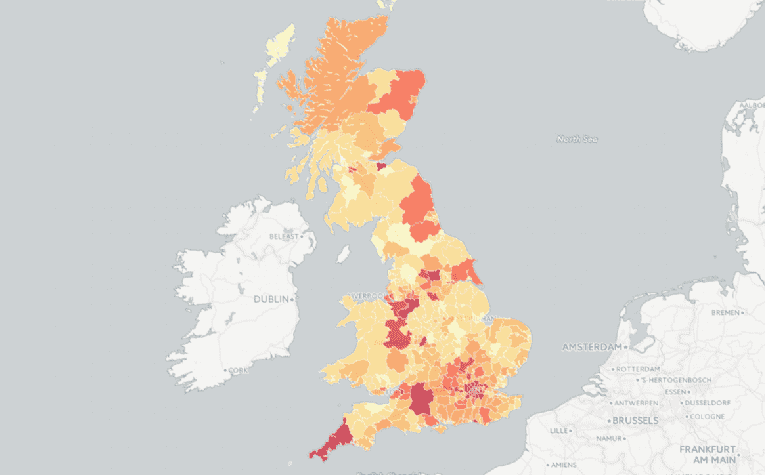
Interactive map: how debt varies across Britain's housing market
"New analysis of housing debt shows how different mortgage constraints affect different areas of Britain."

Tagged Articles
"New analysis of housing debt shows how different mortgage constraints affect different areas of Britain."
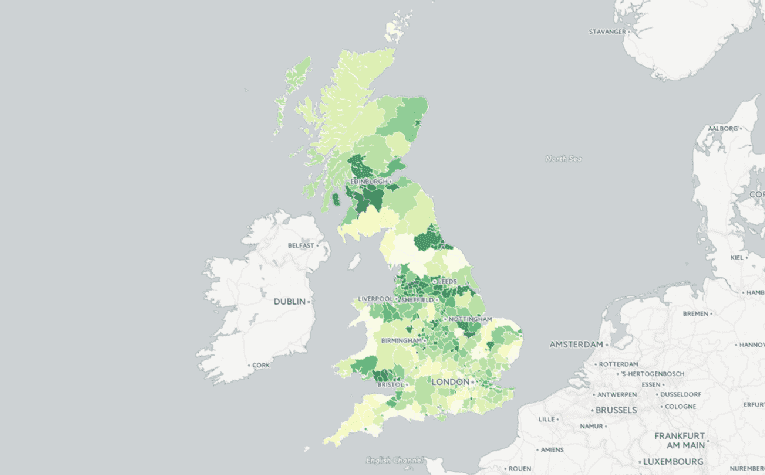
"Our interactive map below shows the inflation of house prices in England over a 10-year period."
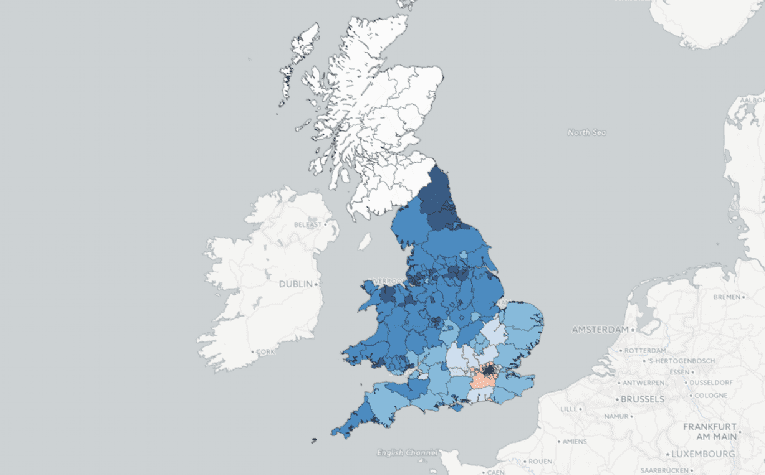
"A property's value depends partly on the quality of the nearest state secondary school. See how this applies in your area."
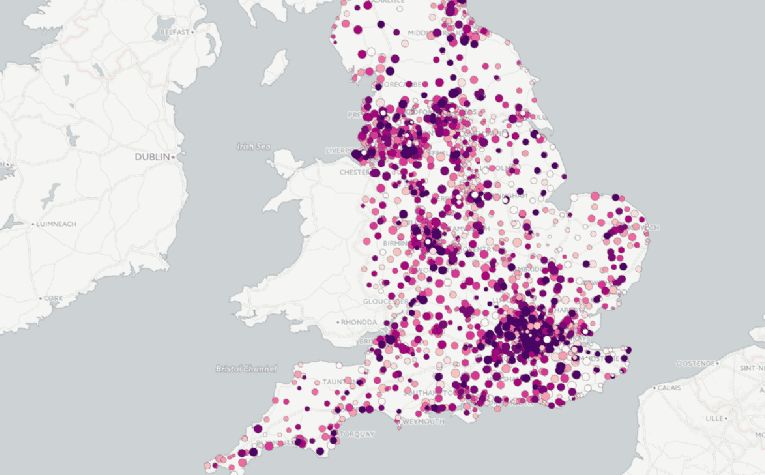
"Sales of properties worth £1m and over have tripled in ten years. Our interactive map reveals where they were sold, and when. "
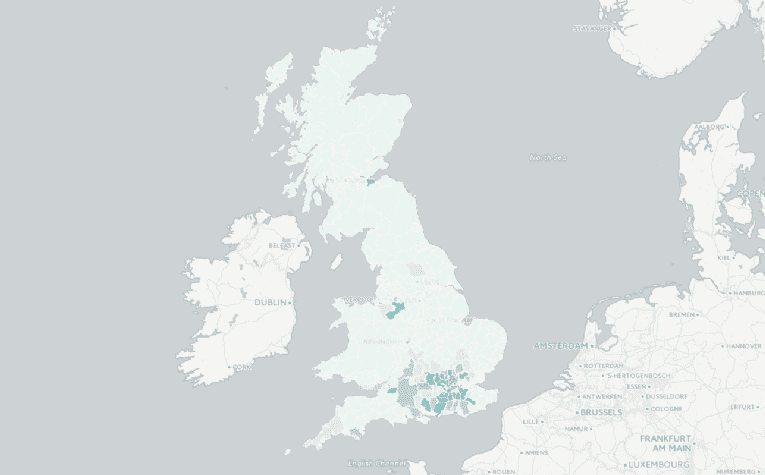
"On an interactive map, we've presented the most common household type living in the private rented accommodation across the country."
"We've got the total value of the country's homes mapped, from the Shetland Islands to Cornwall, and all points in between."
.jpg)