market update
Muted average value growth and significant price variations characterised the market last year

.jpg)
Muted average value growth and significant price variations characterised the market last year
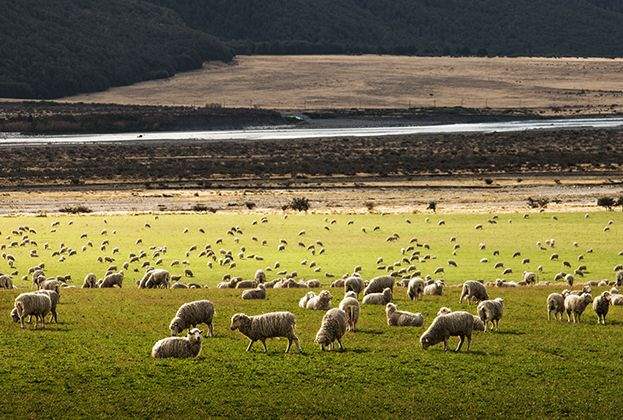
189,000 acres Amount of farmland in Great Britain marketed during 2018 compared with 152,500 acres in 2017; an increase of 24%
Values to December 2018
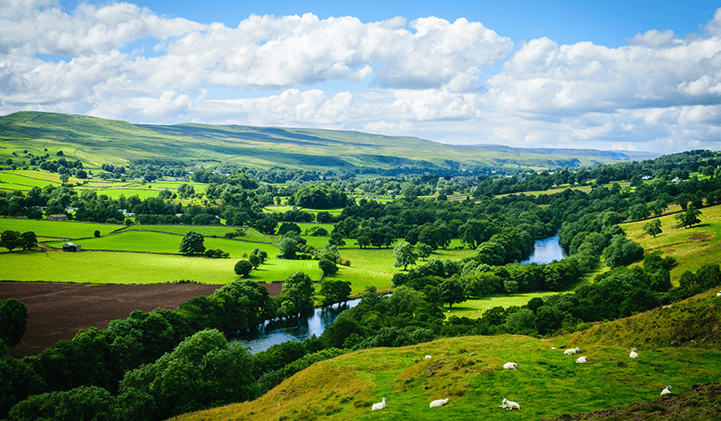
Farmland value growth continued to be muted during 2018, with significant price differences for both land types and regions. Our Farmland Value Survey shows that during 2018 the average value of all types of farmland in Great Britain fell by -1.8% to £6,700 per acre. The average value of prime arable land fell by -2.0% to £8,760 per acre. Average values for all land types in Scotland remained unchanged, whereas average values in England and Wales fell -1.8% and -3.9% respectively.
Across England values for arable land continued to show the widest range of values, but the period of price adjustments of the past four years appears to be easing, with clear signs that values for most regions and land types have now stabilised, albeit at a very local, almost farm by farm level.
Supply to December 2018
In Great Britain 187,000 acres of farmland were marketed during 2018, compared with 152,500 acres in 2017; an increase of 22%. This was the highest level of market activity since 2008 when over 195,000 acres were publicly brought to the market.
During 2018 supply in England (132,500 acres) rose by 29%, while in Scotland supply (43,000 acres) increased by 6% and in Wales 11,000 acres were marketed – an increase of 23%. Supply in 2018 was boosted by two large portfolios coming to the market, of which the farmland amounted to around 20,000 acres. In addition to farms advertised publicly there continues to be a healthy private market for farms and estates.
Buyer and seller profiles in 2018
Analysis of transactions during 2018 where Savills acted for either the buyer or seller shows that the buyer profile has been fairly static over the past five years. Farmers represent around 45% of all buyers, with 85% buying to expand current operations. Around half of buyers are private non-farming/lifestyle purchasers, who cite a variety of reasons for buying from residential and sporting (18%) to investment (23%) and expansion (39%) of existing land holdings.
The remainder are institutional and corporate buyers, including conservation organisations, who are principally buying for investment. Although the overall proportion is small, there is an indication that the presence of these buyers in the market has weakened slightly possibly due to uncertainty in the public subsidy regime for farmland and a refocus of investment into alternative asset classes, which are currently performing better than farmland.
Sales data shows the proportion of farmers selling has fallen each year since the EU Referendum in 2016. In 2018 farmers represented 39% of all sellers; the lowest figure recorded for at least 25 years. This is despite the highest area marketed since 2008 (as noted above) suggesting that farmers are adopting a ‘wait and see’ position in the current political and agricultural policy climate. This is also supported by a significant fall in the proportion of debt related sales during the past year; at 14% of all transactions, it was significantly lower than the 20% recorded over the previous three years. Defra’s estimate of the 2018 Total Income from Farming in the UK is 15% lower than in 2017, which was the highest in real terms for over 20 years. We suspect that we will see more debt related sales in the next few years as noted previously.
.png "Figure 2")
Farmland figures at a glance
Source: Savills Research
3 other article(s) in this publication