Research article

The true value of UK housing

With low interest rates and strong consumer sentiment, 2016 witnessed a rapid rise in the value of UK housing, but has the market reached a turning point?

Q The total value of the UK’s housing stock is now £6.79 trillion, 3.65 times the size of its economy. It has risen by £1.5 trillion in the past three years. Can this continue?

A These pretty mind blowing numbers primarily reflect house price growth that has been driven by a combination of low interest rates and, for the most part, a strengthening economy. They mean private housing wealth stands at over £5 trillion for the first time.

But the £1.5 trillion increase has been heavily influenced by the powerhouses of London and the South East, which together have accounted for over one third of the growth.

As we look forward, there is a series of factors that are likely to mean that price growth slows.

As the implications of the decision to leave the EU become clearer, economic uncertainty is likely to feed into weaker consumer sentiment and tighter household finances. We expect price growth to slow across the country for the next two years or so.

After this period of buyer caution, we do expect things to pick up. But rising interest rates will put a squeeze on affordability for mortgaged buyers, especially in the areas of the country that have seen some of the biggest house price increases.

We are already beginning to see this play out. Despite strong annual growth, we have seen three-month on three-month house price growth fall back to 1.7% in December 2016 across the UK as a whole. To put that in context, 12 months previously it was 2.4%.

In London, the change has been more pronounced. The three-month on three-month measure has fallen from 3.7% to just 1.2% over the same period.

Value of all UK housing stock in 2016

Q To what extent has the growth in value been driven by rising levels of debt?

A Not significantly, because of much lower numbers of house purchases compared to before the credit crunch. This reduced activity has been really noticeable among those upsizers who need a mortgage, unlike cash buyers who now have much greater purchasing power.

To put this into numbers, regulation and lender caution means that outstanding levels of mortgage debt have risen by just 10% (£120 billion) over the past five years. By contrast, the level of privately held housing equity has risen by a chunky 49% in the same period.

Still, combined with a fall in the number of mortgaged owner occupiers, the average outstanding mortgage across England and Wales has risen by £18,500 over the past five years.

Q How much has the average increase in debt levels been driven by London?

A In London, the average outstanding mortgage has grown by much more. It has risen by some 29%, or £60,000 in cash terms, over this period. Which means that it now stands at over £240,000.

Of course, for those getting onto or trading up the housing ladder, the figure is higher. This has caused buyers in the capital to stretch themselves further, essentially by borrowing more relative to their income.

The Council of Mortgage Lenders suggests that the average homebuyer in London borrowed 3.4 times their income in 2011. In 2016 that stood at 4.0.

Despite the fact that the level of housing equity in the capital has risen by 71% in the past five years (an astonishing £534 billion), that means those who need a mortgage are now bumping up against the limits of mortgage regulation. But with interest rates only expected to rise gradually when they do go up, this is likely to act as a drag on house price growth in the future, rather than anything more serious.

Q So who are the beneficiaries from these rising levels of housing wealth?

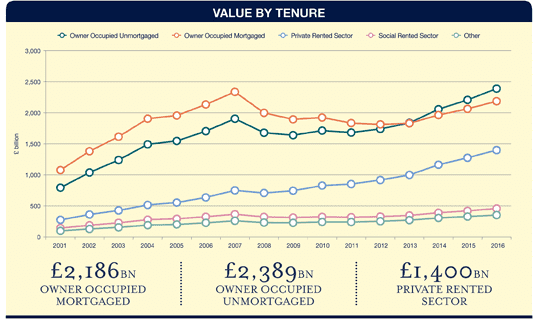
A The amount of housing wealth held by homeowners who have completely paid off their mortgage has risen very significantly, as those who got onto the housing ladder in the second half of the 20th century live longer. It is now over £2.39 trillion – twice that of the equity held by owner occupiers who have a mortgage.

This means those over the age of 65 now hold an estimated 43% of all owner occupiers’ housing equity – a figure over £1.5 trillion.

Similarly, private landlords have seen the amount of equity they hold increase from £693 billion five years ago to around £1.2 trillion in 2016. They have both increased the amount of stock they own and have benefited from price growth to build a substantial pool of property wealth.

By contrast, homeowners under the age of 35 hold less than £200 billion of net housing wealth, as the generational divide in housing has widened.

Value by tenure

Q Who has benefited most from low interest rates and will be squeezed when they rise?

A Even though they have been moving less often, the main beneficiaries have been 35-49 year old homeowners who have over £500 billion of mortgage debt.

While that debt has been relatively cheap to service, increasingly they have extended their home rather than traded up. This reflects the cost of buying a property with an extra bedroom and the availability of mortgage debt to do so.

Our analysis of asking prices from OnTheMarket shows that the cost of moving from a two-bedroom to a three-bedroom property averages £77,000 across the local authorities of England and Wales. Across the boroughs of inner London it stands at £220,000 and in outer London at £138,000. All of these numbers increase when looking at a move from a three to a four-bedroom property.

This cost has also resulted in an increase in the number of people moving into the commuter zone in search of greater value for money. It is a trend we expect to gather pace as interest rates increase from their current benign levels.

Q Does that mean you expect a change in the pattern of house price growth once the uncertainty around Brexit starts to clear?

A It is one of the reasons, particularly as the gap in value between London and the rest of the country is currently at an all-time high.

The value of housing stock in five of London’s most expensive boroughs fell by £9.6 billion in 2016, with the highest amount of price growth in the capital pushed out to the suburban borough of Barnet.

But more notably, in 2016 the total growth in the value of housing in the South East was higher than in London for the first time since 2004. Perhaps surprisingly, Slough showed the highest percentage price growth anywhere in the country, as needs-based buyers and investors turned their attention to more affordable locations within striking distance of London.

As the uncertainty of Brexit subsides and modest price growth returns, we expect it to be weighted to London’s hinterland, before rippling more widely across the rest of the UK.

As it spreads to the Midlands and the North, we expect to see it gain the strongest foothold in more affluent markets first.

This has already been seen to an extent. The value of housing stock in York, for instance, has increased by £3.9 billion to £20 billion in the past five years, while the value of housing stock in Solihull rose by £2.6 billion in 2016 alone. By contrast, the value of housing stock in Hartlepool fell by £76 million last year.

The geographical distribution of wealth

Q And what about the gap in housing wealth between different generations?

A Even if Government policy slows its growth, we expect the generational divide in housing wealth to become further entrenched.

This means increased demand for private rented accommodation, despite measures to make residential investment less attractive.

The mortgaged buy to let landlord will be squeezed by more stamp duty, a greater exposure to capital gains tax, less income tax relief and greater mortgage regulation.

But existing mortgage regulation for those looking to buy their own home is likely to keep deposits high and continue to restrict access to homeownership.

For aspiring first-time buyers and second steppers, that points to continued reliance on the bank of Mum and Dad and schemes such as Help to Buy.

We also expect to see more downsizing among older homeowners who are looking to unlock and pass on some of their housing wealth to younger generations.

Ultimately, this indicates, even if we don’t see the same substantial increases in the value of the UK’s housing stock, that there are still opportunities for cash rich buyers, the build to rent sector that is now beginning to build up a head of steam and developers able to tap into the grey pound.

Which generation owns the most?

Other articles within this publication

4 other article(s) in this publication