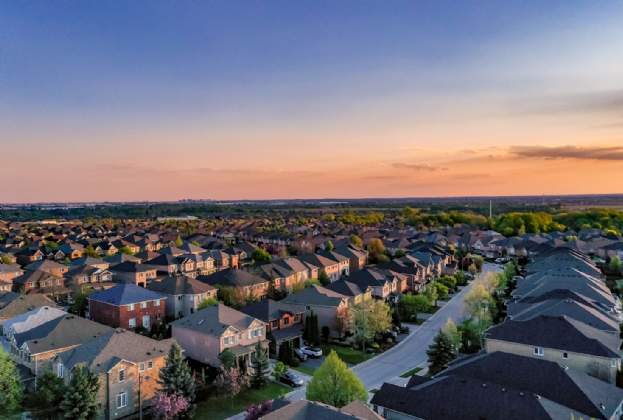
Growing households and housing supply

The Savills Blog

Why growing households in England raise questions for housing supply

According to the latest Census, the population of England has grown at a faster rate than households over the past 10 years. Since 2011, the population has increased by 7 per cent, whereas the number of households has risen by just 6 per cent. Because of this mismatch, there are now an average of 2.41 people per household in England, up from 2.40 in 2011.

The figures represent a departure from existing household projections which expected a trend towards slightly smaller households. The 2014-based projections anticipated an average household size of 2.35 people by 2021. This growth in the size of households may seem minor, but larger divisions begin to form at a more granular level, particularly in urban areas, or those with stretched affordability.


The relationship between households and affordability

House price to earnings ratios are the Government’s preferred method of monitoring affordability across the country. Along with household projections, the ratio forms the basis of the Government’s housing need calculations. Using the ratios, we have split England into five groups, ranging from the least affordable to most affordable, as highlighted in the map below.


Local authority affordability 


Local authority affordability

There is a strong relationship between affordability and household size, with larger households found in less affordable areas. The least affordable 20 per cent of local authorities have an average of 2.49 people per household, according to the 2021 Census, compared with just 2.39 people per household in the country’s most affordable places. Larger households are also linked to urban areas, and London boroughs such as Newham and Redbridge have recorded an average of up to 3.0 people per household.

Some of the larger households are a result of substantial growth in population relative to households over the past 10 years. For example, the least affordable 20 per cent of local authorities have seen their populations increase by seven per cent, compared with household growth of just 5 per cent. The most significant example is in Barking and Dagenham, where the resident population increased by 18 per cent while households increased by just 6 per cent.

The growth in household size above previous projections is an indication of supressed household formation, something that is particularly evident in more expensive areas where individuals unable to access the housing market are staying in family homes or shared households for longer.

Over a prolonged period of time this can become an issue for housing supply as reduced growth in households will feed into future projections, limiting the ability of local authorities to plan accurately for enough new homes to meet demand.

Population change and household size

Population change and household size

Recommended articles