Household projections have always had their limitations as a tool for planning the numbers of homes that need to be built in local authorities across the country. But the signs are that these limitations are about to become greater, at the very time that Government has hardwired them into the formulation of local plan targets.
Until recently, household projections came with the disclaimer that ‘they are not an assessment of housing need [...], they are an indication of the likely increase in households given the continuation of recent demographic trends’.
This means that places where planning restrictions in the past have resulted in few new homes being built, and therefore fewer new households forming, get lower household projections. This then feeds into lower targets for future housebuilding, a circularity that has been widely explored before (see Measuring housing need).
Another concern is that if household formation has been constrained by economic circumstances at a particular point in an economic cycle, that too might temporarily change household formation rates which then influence the projections. But the use of the long-term trend in declining household size since 1971 meant these short-term effects had a limited impact.
That is no longer the case.
With the shift of responsibility for producing the projections from the Ministry of Housing, Communities & Local Government (MHCLG) to the Office for National Statistics (ONS) comes a change in methodology. Gone are the long-term trends. Instead projections will be based on trends going back only to 2001.
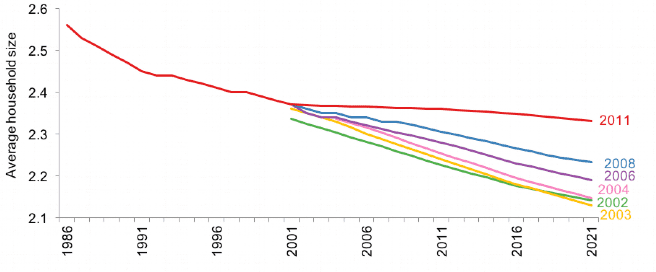
The 10 years from 2001 to 2011 surprised demographic forecasters. Against all expectations, the long-term decline in household size stopped (see chart below).


