
(2).jpg "House building")
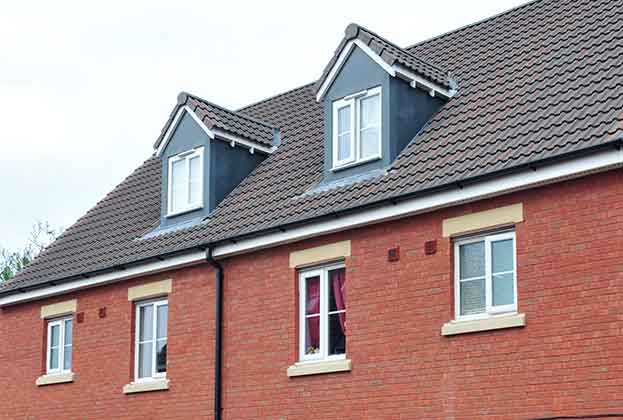
The debate continues to rage around how many new homes we should be building each year in England. The Government recently published a proposed method to calculate housing need which sets the annual figure at 266,000. Conversely, other market commentators have suggested, based on historic household formation patterns, that true need could be much lower.
The wild variance comes from a misunderstanding of the relationship between past household formation, housing supply and future housing need. Household projections, the starting point for calculating need, project forward growth trends based on the previous five years. They are consequently informed by previous rates of household formation.
The main challenge with this is that household formation does not happen in a vacuum. New households can only form if there are homes for them to move into. Ed Conway suggested in an article in The Times recently that government projections are overstating need for new homes at 260,000 per year as household growth has only averaged 152,000 a year since 2008. However, the household growth figures directly reflect the rate of delivery of new homes, which has averaged 152,700 over the same period.
The impact of the shortfall in delivery is most clearly seen through looking at household size. Nationally, household sizes have been decreasing – down from 2.91 people per household in 1971 to 2.35 in 2011.
However, a different trend emerges if the national picture is broken down into areas of different housing affordability. In the locations with the highest house price to earnings ratio, which are the least affordable housing markets, and the areas where there is the greatest demand for new homes, average household size increased from 2.38 in 2001 to 2.44 in 2011. Household size in this part of the market has followed a different trend to the rest of country, where household size remained steady or fell. This suggests that there has been suppressed household formation as a consequence of years of insufficient housebuilding and an unaffordable housing market.
.png "Image treatment")
.png "Image treatment")
.jpg)
.jpg)

-large---midland-heart.jpg)
.jpg)