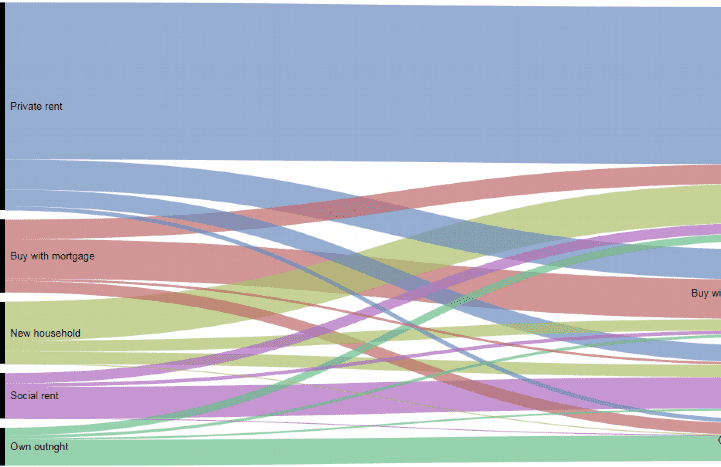
Latest data from the 2015-16 English Housing Survey showed that a total of 2.1 million households had moved home in the previous year, including 317,000 new households. Our flow diagram attempts to visualise the quantum of moves between different types of housing in the course of one year (reading from left to right).
(1).jpg)

Source: Savills Research using English Housing Survey and RAW Graphs
The majority (63 per cent) of moves were within the same tenure, as some 1.3 million households moved from one owner occupied home to another, from a private rented home to another private rented home or from a social rented home to another in the same sector.
By far the greatest number of moves were seen in the private rented sector (see blue bands), while there was relatively little movement within the social rented sector. A total of 787,000 households moved within the private rented sector and 196,000 new households formed within the sector.
At the same time, 187,000 households moved into private renting from another tenure. Of these, almost two-thirds (135,000) were moving from owner occupation, potentially the result of debt, divorce, or the phenomenon often referred to as ‘renting to rent’, whereby home owners rent out their homes to facilitate a move to another town or city.
Over a quarter of a million households left the private rented sector, with 172,000 (67 per cent) making the move into owner occupied homes, while the remainder moved into the social rented sector.
On balance, the private rented sector gained 250,000 households, to total 4.53 million or 19.9 per cent of all English homes and accounted for over half of all newly formed households.
Further information

(4).jpg)
(1).jpg)
.jpg)
.png)


.jpg)

.jpg)