
Welcome to your latest Central London office market watch, exploring insight from the City and West End office occupational markets
Market view
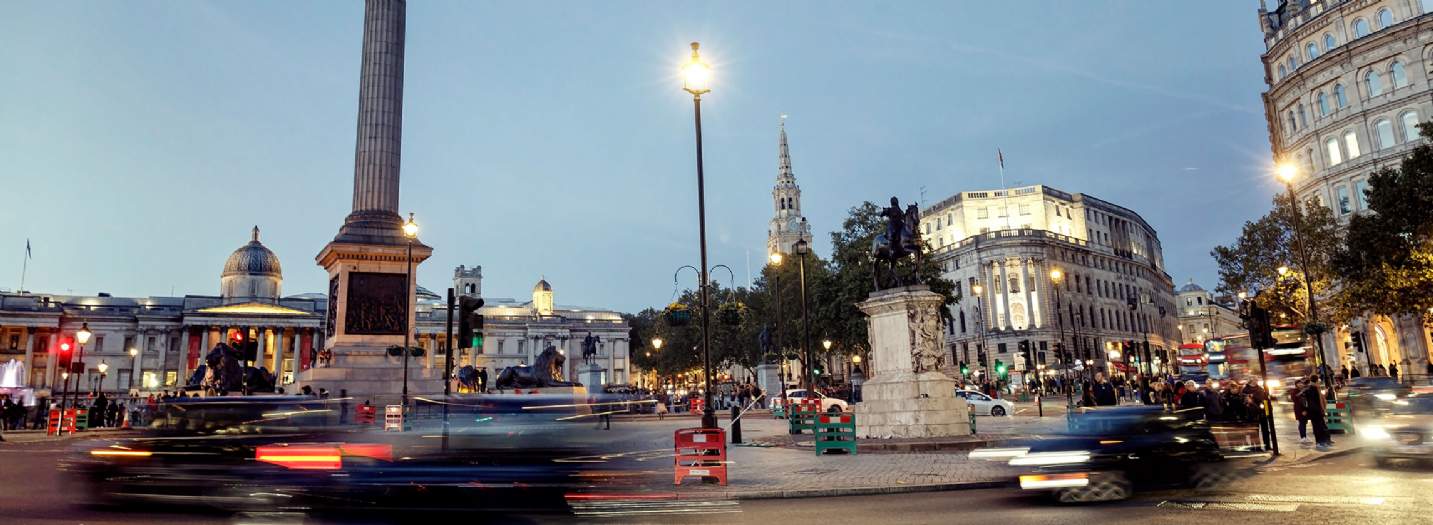
Across the City market
March saw a strong end to the first quarter with 689,189 sq ft transacting across 46 deals. This brought the Q1 total to 1.14m sq ft across 94 transactions. This was down on the long-term average by 17%. However, it was up on the five-year average by 2% and up 1% on Q1 of last year. The Insurance & Financial sector has continued to be the main driver of leasing activity at the start of this year and has accounted for 29% of space acquired (by sq ft) and 22% by number of transactions. Another trend we have seen this quarter is the focus of occupiers on leasing City Core buildings, in particular in EC2, where over half (588,025 sq ft) of this quarter’s take-up took place. This is the highest proportion we have ever seen and a 60% increase in terms of volume on the five-year average.
Interestingly, Q1 has seen the vacancy rate drop by 50 bps to 9.0%, although this is in part down to the strong take-up in the City Core, it can largely be attributed to a lack of new developments being added to supply, and we anticipate the vacancy rate will rise to 9.4% by the end of the year. There continues to be an undersupply of prime stock, with only 36% of supply with a BREEAM rating of ‘Excellent’ or higher compared to the 63% of this month’s take-up being of this BREEAM rating.
Highlights
Market view
Across the West End market
Leasing activity at the end of Q1 totalled 562,626 sq ft, down 33% on the ten-year average, in what was the weakest Q1 since 2009. This lower level demand can partly be explained by the absence of larger deals (15,000 sq ft+), with just seven transactions taking place in Q1, roughly half the number that typically completes. A notable rent, however, was achieved this quarter at 30 Berkeley Square, W1, which saw a confidential financial occupier acquire the third floor for £200 per sq ft, the same building which set the current West End record rent of £277.00 per sq ft in 2020. The Financial Services sector continues to be the primary driver of demand, having accounted for 30% of space acquired this quarter, while demand from the Tech & Media continues to remain subdued with just 63,312 sq ft completing, down 74% on the ten-year average.
Soho saw the greatest level of activity, accounting for 19% of take-up this quarter, followed closely by Hammersmith (19%), although the latter’s figure was skewed by the 73,000 sq ft pre-let at One Olympia, W14, by IWG. There has been less of a focus on core markets compared to recent quarters, likely due to the low vacancy rates in Mayfair (3.3%) and St James’s (4.4%) relative to the West End as a whole (7.3%).
On a positive note, under offers rebounded this quarter, after falling sharply at the end of Q4 following a busy end to the year, and currently stand at 1.01m sq ft, up 28% QoQ, albeit still 22% lower than the five-year average.
Highlights
EXPLORE MORE INSIGHT >
Why there’s no stopping construction in Central London
A difficult and uncertain economic background combined with a challenging debt market has meant that investment and construction across all sectors have proved relatively tricky to forecast over the past 12 months.
< Read more >
If you have any questions, please do not hesitate to get in touch via the Authors panel