
Leasing activity slows over the summer, but demand from the Financial Services sector remains robust
City monthly take-up was at its lowest level in six months, with the typical summer lull in activity resulting in only 320,233 sq ft completing across 16 transactions. This brought year-to-date take-up to 3.2m sq ft, down 18% on the long-term average.
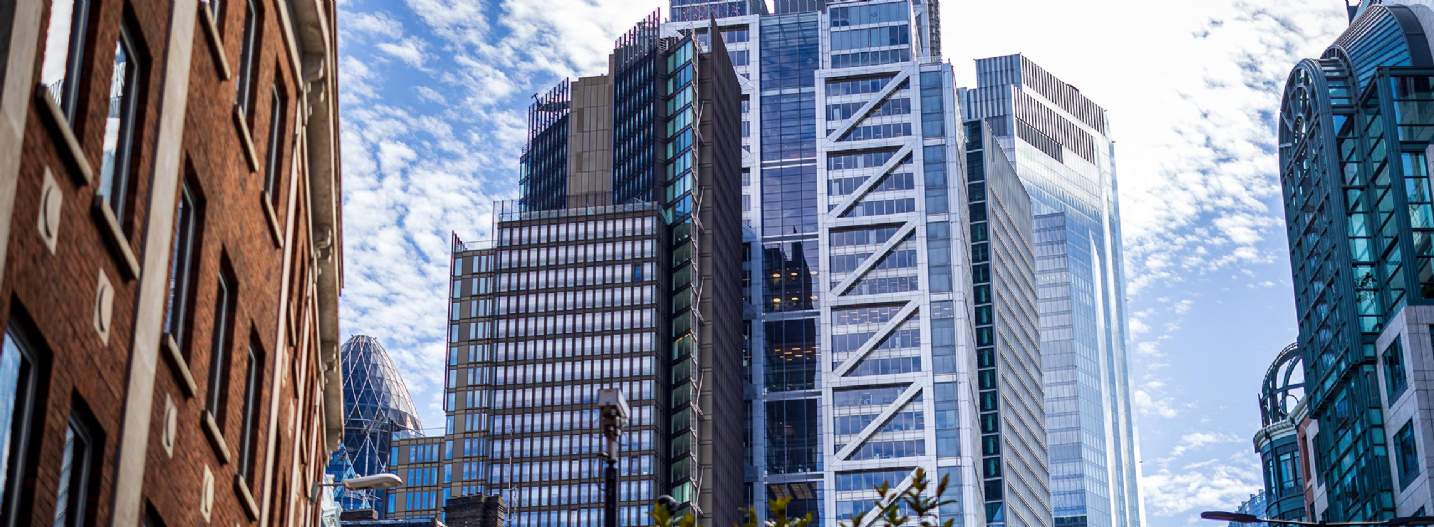
Leasing activity remains heavily weighted towards Grade A space, with 89% of take-up being of this quality. The sustained occupier preference for prime office space is reflected by the fact that two-thirds of space leased has been in newly developed or extensively refurbished buildings. With occupier demand focused on best-in-class office space, the average prime rent for the year so far currently stands at £87.96 per sq ft, which is up 1% on the same period in 2022.
The largest transaction to complete in August was UK private Bank Arbuthnot Latham’s acquisition of The Alpheus Building, 20 Finsbury Circus, EC2, (78,512 sq ft), on a 15-year term. The next largest transaction was at 60 London Wall, EC2, with Rabobank leasing the part 4th and part 5th floors (48,457 sq ft) at £67.50 per sq ft.
Whilst leasing remained subdued, we have continued to see high levels of underlying demand with active City and Central London requirements standing at 9.9m sq ft, up 48% on the long-term average. Further to this, we saw 390,000 sq ft going under offer during August, which helped maintain space under offer at 2.8m sq ft, up 103% on the long-term average.
So far this year, the Insurance & Financial services sector has been the main driver of leasing activity across the City and has so far accounted for 23% of space acquired by sq ft and 20% by number of transactions.
The Professional Services sector accounted for the next highest share of sector take-up with 17%. The majority of which (83%) was driven by Law firms.
We are expecting the Insurance & Financial Services sector will continue to be the main driver of demand as the sector currently accounts for 30% of active requirements. These occupiers have continued to show a strong preference for City Core locations reflected by the fact that 85% of space acquired by this sector has been in this sub-market area.
Overall supply was down 30 bps in August, with the vacancy rate standing at 9.4%. However, we are expecting this to rise with 1.6m sq ft of speculative development completions anticipated over the first half of 2024, (which will be added to supply by the end of Q4).