

LHA rates are frozen at levels set in 2020-21, but did they cover the rents of new benefit claimants in 2022-23?
In response to the pandemic in 2020, Local Housing Allowance (LHA) experienced what was probably its biggest ever increase to the 30th percentile rent in each Broad Rental Market Area (BRMA) (See Local Housing Allowance: increased due to Covid-19).
LHA is the cap on the amount of housing benefit tenants in the private rented sector can receive. It is reviewed annually and effective from April-March every year. The increase meant that, in theory, 30% of rented homes in most areas were affordable to a household reliant on housing benefit.
Since then, LHA has been frozen while asking rents in the UK have grown by 21.5% between March 2020-23, according to Zoopla. Furthermore, open market rental listings have been in decline since 2017. According to Rightmove, the average number of quarterly listings for Q1 in England in 2022 was -35.1% lower than the 2017 average. Renters are therefore competing for a diminishing amount of new stock.
In 2022 10.1% of those who rented privately in England claimed housing benefit. The local authorities with the highest proportion of claimants were Blackpool, Enfield, and Tendring at over 24% of private renters. At the other end of the spectrum, Islington, Cambridge, and Southwark all had fewer than 5% of private renters claiming housing benefit. Private renters in coastal areas were especially reliant, as were areas of North London.
Figure 1 Proportion of private rented households claiming housing benefit 2022
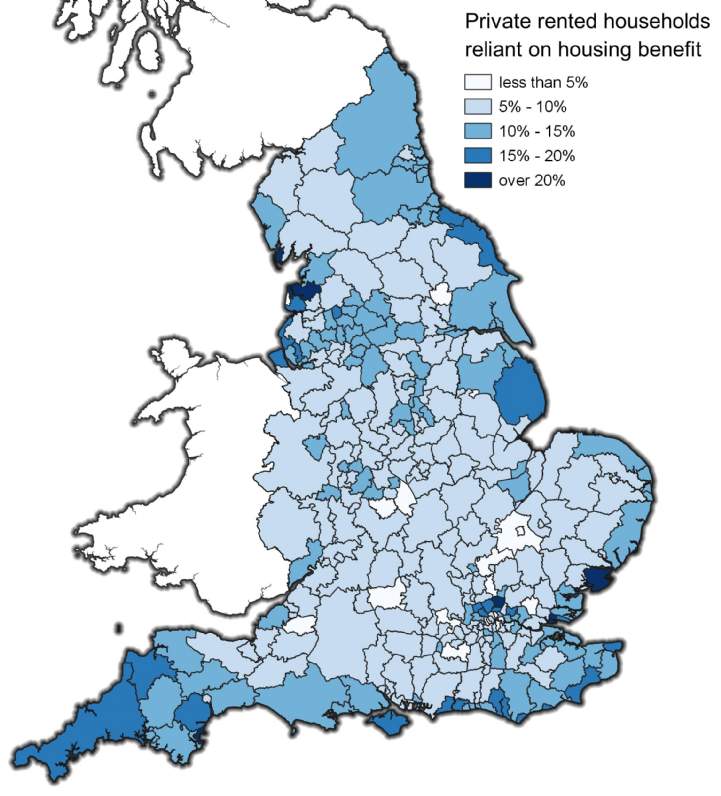
Source: DWP and 2021 Census
By analysing Rightmove listings across the country for the 2022-23 period, it is possible to determine how many of the new listings people who claim housing benefit could afford. To do this our analysis examined 889,922 Rightmove asking rents throughout England during the set period of April-March affordable at LHA rates. Although this does not provide a perfect representation of the entire rental market, because it does not necessarily give agreed rents and is shaped by the nature of stock available within a specified time window, it gives a good indicator and sample of private rents across different geographical regions.
While those reliant on LHA make up 10.1% of private renters, non-benefit-capped claimants could only afford 3% of new rental listings in 2022-23. One-bed properties were the most affordable at 4.7% of listings, however this type of property is not suitable for many benefit claimants, especially families. 2.4% of two-bed properties were affordable, while the figures for three and four bed properties were at 2.0% and 3.4%, respectively.
On the BRMA level, the ambition for LHA to reach the 30th percentile rent was not achieved in any area in England for 2022-23. The highest proportion of affordable listings by a significant margin was in Scunthorpe at 20.4%, followed by Teesside at 13.1% and Bath at 10.3%. The other 149 BRMAs were all below 10%, 43 of which had less than 2% of listings affordable.
Figure 2 New rental listings affordable by Broad Rental Market Area (BRMA) 2022-23
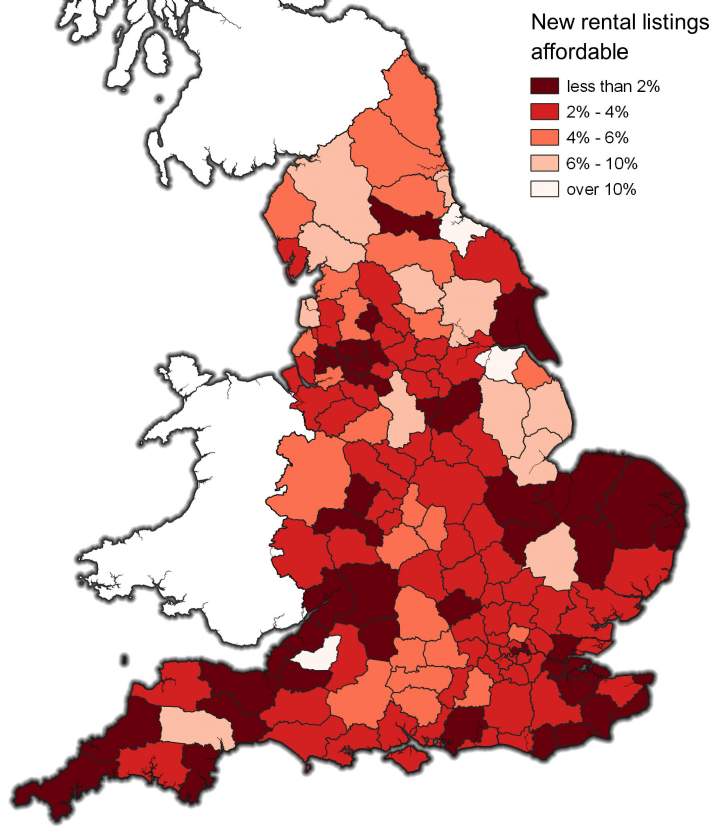
Source: VOA April 2023 LHA tables and Rightmove
Areas in Kent and Sussex had some of the lowest levels of affordable listings, with three out of the bottom five BRMAs. Thanet was the second least affordable BRMA at just 0.3%, while Dover-Shepway, Sussex East, Eastbourne, North West Kent, and Ashford all had less than 1.2% of listings affordable.
These areas have notably become popular since the pandemic and have experienced significant house price and rental growth. For example, the Thanet and Dover local authorities have seen rental growth of 28.2% and 25.2% from March 2020-23 according to Zoopla, much greater than the South East average of 19.2% and the UK average of 21.5%.
On a local authority level, an appropriate test is whether the proportion of rental listings affordable to those who claim housing benefit is equal to or greater than their proportion of private renters. For example, if 15% of private renters claim housing benefit but only 10% of listings are affordable, this creates a proportionate shortfall of stock of at least -5%.
Figure 3 Difference between affordable listings and proportion of private renters who claim housing benefit
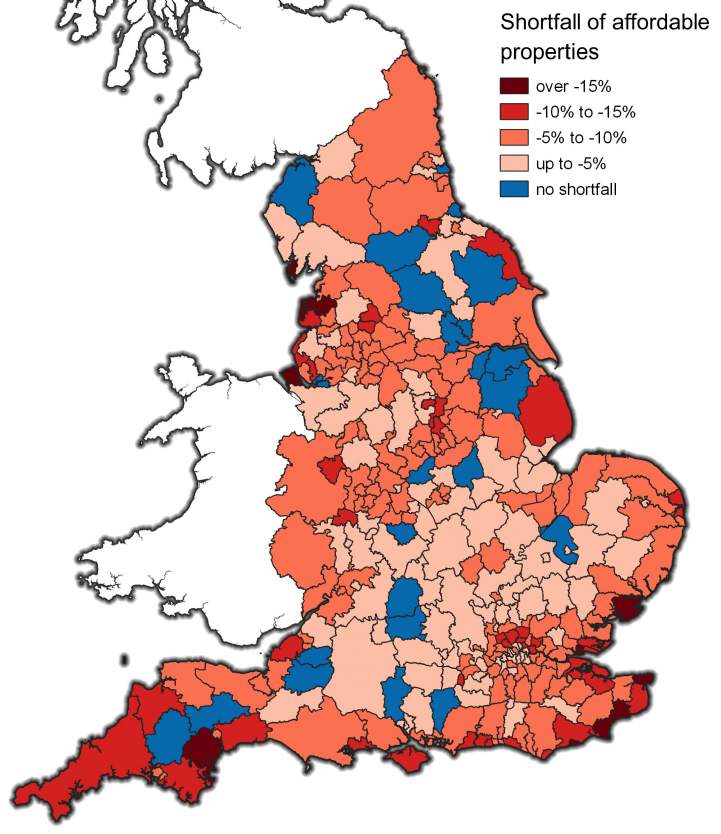
Source: DWP, 2021 Census, VOA April 2023 LHA tables and Rightmove
Using this metric, only 22 out of 308 local authorities had an appropriate proportion of stock available. Instead, 235 local authorities had a shortfall of up to -10%, while 51 had a shortfall of over -10%.
Torbay had the greatest difference, with 23.8% of private renters reliant on housing benefit when only 1% of private listings were affordable. Similarly, Wyre, Barrow-in-Furness, Tendring, and Castle Point all had shortfalls of over 17%.
Other areas with large gaps in proportionate affordability include parts of Liverpool and Blackpool in the North West, Cornwall and Devon, and the vast majority of the South East, especially Kent, Sussex, and in the Thames Estuary.
On a regional level, no area in England had a proportionate amount of stock available. The North East had the largest proportion of affordable listings at 7.1%, however this fails to match the 12.5% of private renters who claim housing benefit. The North West had the greatest difference with a shortfall of -8.6%, followed by London and the South West both at -8.1%.
At the other end of the spectrum, Yorkshire and the Humber and East of England had the smallest proportionate shortfalls, although these were still at -5.2% and -5.4% respectively.
The need to re-review LHA in a changing market
Under current rental levels, recipients of LHA have severely limited options in the private rental market. They face heightened competition amongst themselves as well as with other lower income groups, including graduates. This is putting significant pressure on the lower end of the market across the country.
Those who claim housing benefit must either supplement their income with other means or rent properties that do not necessarily meet their housing needs, be it through their location or size. This is happening in the context of increasingly stretched budgets due to rising cost of living pressures.
The lack of affordability demonstrates the need to re-evaluate LHA in response to the significant rises in rents. Any review will need to take account of mitigating factors such as the benefit cap. As LHA has been frozen at 2020 levels for 2023-24, the proportion of properties that is affordable is likely to be reduced further from its already very low levels as rents continue to grow.
The reliance on the private rented sector for those with lower incomes has increased at a time when availability of social housing has fallen. A policy emphasis on supply as well as demand will ultimately help alleviate pressure on the private rental market in the long term and provide much needed affordable housing.