The pressures have increased for an upward yield movement for some sectors
Holding steady for now
The prime yield data for June (see below) shows that none of the 13 sectors saw an outward shift. However, two more sectors had an upward trend arrow applied to denote an increasing pressure and likelihood for an increase. All of the retail sectors have a potential upward movement in their yield in the short-term.
The prime yield data for June shows that none of the 13 sectors saw an outward shift. However, two more sectors had an upward trend arrow applied to denote an increasing pressure and likelihood for an increase. All of the retail sectors have a potential upward movement in their yield in the short-term.
For the first time, in seven years, the 1H data has fallen below the £20bn level. At £17.3bn, the first half of 2019 will be around 40% lower than the same period last year. Overseas investors have accounted for a 46% annual average share in the last three years. So far for 2019, overseas investors have accounted for 42%, by value. US and Middle Eastern share of investment is above average; European (ex-Germany) and Far Eastern are below average so far in 2019.
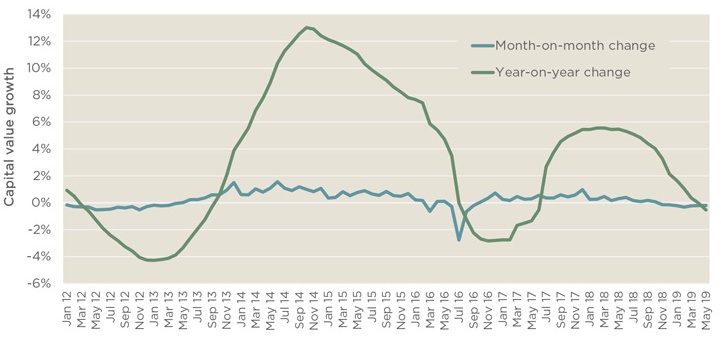
As shown in the chart below, the UK capital value property cycle has shortened since the GFC, partly driven by Brexit in 2016. There is a four-year peak-to-peak in the monthly MSCI data. On this basis, we would expect capital value growth to ‘bottom-out’ at the end of 2020 as it has moved in to negative territory in the past two months.

Slowing down The last seven months have seen a fall in monthly growth of UK ‘all property’ capital values. Consequently, annual growth has gone negative for the first time in two years
Source: MSCI
Understanding office workers’ preferences
An understanding of users’ preferences for any commercial property is vital to ensure it meets the needs and provides the most appropriate environment to enhance productivity and profitability. A company located in such a building will achieve higher employee retention.
Savills have recently updated their What Workers Want survey, which began in 2008 and has been completed every three years since. Using YouGov, a well-respected polling organisation, Savills have asked the views of over 11,000 office workers in 11 European countries. Savills are able to identify the key characteristics of the office to determine what is preferred. In total, around 200,000 data points have been created and further analysis of the data will provide many more.
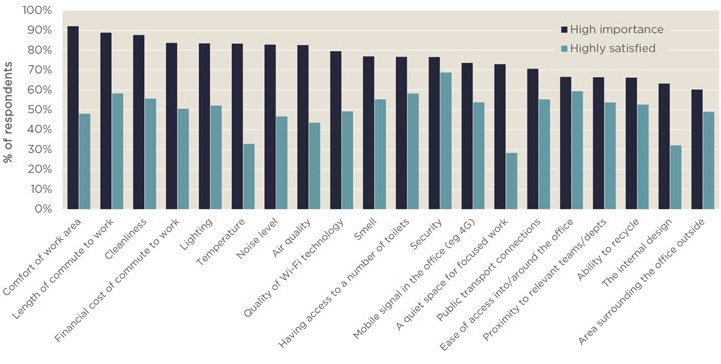
The chart below outlines the top 20 variables, from a list of 49, which the office workers classify as being of high importance. Compared to 2016, the ‘comfort of work area’ moved to the top spot and this is something that tenants have control over, with or without assistance from the landlord. Taking the commute out of the equation, the office environment is key for workers and office spaces that don’t keep employees happy will become obsolete a lot sooner. It is also vital to ensure the IT connectivity of the office is of the highest quality and this is one factor that the owner/landlord can ensure the building is capable of delivering. More enlightening for landlords/owners is the level of satisfaction of each variable. Take the most important factor in the chart, less than half of the respondents are highly satisfied - this is an issue for the tenant. However, one of the biggest ‘gaps’ is for temperature. This is a building issue and buying an office building where this may be a problem will impact on attracting occupiers and be a costly issue to rectify.

Closing the gap for office landlords is key to creating the most productive environment for office workers. A happy and satisfied worker will result in a happy (income-producing) tenant
Source: Savills Research
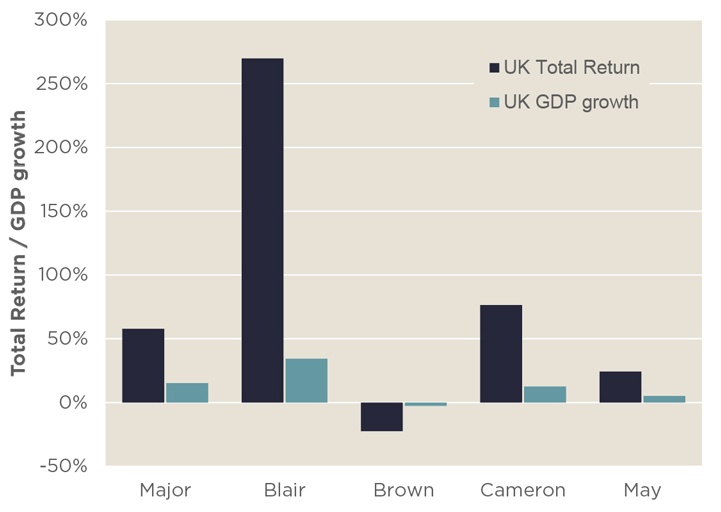
The UK is in anticipation of who will emerge as the next Prime Minister and for us in the commercial property industry, we ponder the prospects for the sector in terms of investment returns. The chart to the right shows the UK commercial ‘all property’ total returns during the five most recent Prime Ministers and corresponding UK economic growth story. UK economic growth averaged 2% from the Major to May period - the outlook for the next five years is 1.5% per annum.
The expectation for a lower economic growth going forward, post Brexit, the question is whether it will it be more ‘Brown’ than ‘Blair’. The relationship between GDP growth and total returns shows a ‘multiplier’ of six, on average. This puts ‘all property’ total returns in the high single digits for the next few years, but with potential upside.

Labour and Conservative Prime Ministers’ time in office has seen varying performance for UK commercial property
Source: MSCI, Office for National Statistics
.jpg)