
.jpg)
Since 2002 the level of growth in farmland values has been strong and demand continues to increase
During the past 16 years (2002–2018) our Global Farmland Index recorded an average annualised value growth of 12% (see Figure 1). The emerging markets of Central Europe and South America witnessed the strongest growth over this time.

Figure 1 Average annualised capital growth of values
Source: Savills Research and USDA, Eurostat and various other data sources/estimates
Much of the value growth took place in the early 2000s, with the greatest percentage rises in the five years between 2002 and 2007 when the Global Farmland Index recorded an average annualised increase of 28% (see Figure 2). The following five years witnessed slower average annualised growth of 10.9%, resulting in a correction in values notably for Ireland and Denmark, where a substantial rise in farmland prices had previously been recorded.

Figure 2 Global Farmland Index
Source: Savills Research and USDA, Eurostat and various other data sources/estimates | Note: This is based on data from the average value of crop/arable land in US$ per hectare from 15 key farmland markets – Argentina, Australia, Brazil, Canada, Denmark, France, Germany, Hungary, Ireland, New Zealand, Poland, Romania, United Kingdom, United States and Uruguay. Converting to US$ per hectare gives potential investors a good starting point for comparable analysis. It is a common denominator, which corresponds to the currency of global markets. The values are relative to those in the year 2002 (2002 = 100). Exchange rates will affect the performance in domestic currency.
Farmland is a strong performing asset and investors are attracted by the capital appreciation and the potential to maximise farming returns through management intervention, particularly in the emerging markets
Savills Research
Compared to the exceptional highs of the early 2000s and since the 2008 international banking crisis, there has been a softening of average values and our Global Farmland Index has recorded a more subdued annualised rise of just 0.7% in the past six years. But the rate of growth varies considerably between countries and is influenced by many factors (see Risk & Return).
Farmland values have outperformed commodities over the long term (see Figure 3) and provide an inflation hedge in recessionary times. The long-term fundamentals of farmland ownership still apply. With a rising global population and a new urgency on climate change responses in some developed economies, the long-term importance of food and energy security is not expected to abate. Globally, we expect the demand for productive farmland to increase.

Figure 3 Global farmland values outperform commodities
Source: Savills Research and USDA, Eurostat, WTO, OPEC, FAO and various other data sources/estimates
Regional performance
WESTERN EUROPE
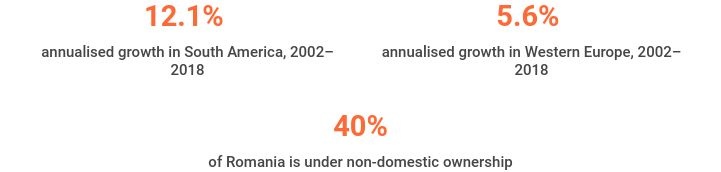
Following a period of strong growth Western Europe has seen a softening in average annualised values over the past five years with the exception of Germany (5.4%). The UK and Ireland witnessed the largest fall at -3.0%, followed by Denmark (-2.9%) and France (-1.5%). Western Europe scores favourably on our Risk Matrix due to sound infrastructure and transport networks providing good access to farms and markets, lower political risk and lower foreign investment restrictions. However, income returns are lower and there is less potential for maximising returns as farming systems are well developed.
SOUTH AMERICA
Between 2002 and 2018 average annualised capital values increased by 12.1% in Brazil, Argentina and Uruguay. However, over the past five years there has been a fall in values of -4.5%. Our Risk Matrix ranks South America as relatively high risk, but the potential to improve agricultural returns through infrastructure investment remains strong. In addition the availability of land, water and labour resource can be higher. The rules on buying farmland are restrictive in Argentina and Brazil, although a change in Brazil’s government in 2019 may result in a loosening of restrictions. There are no restrictions for overseas investors in Uruguay.
AUSTRALASIA
Australia and New Zealand have recorded lower rates of growth in recent years, albeit average values continue to rise in Australia, with sales of substantial blocks of land to overseas investors in 2019. New Zealand has experienced a slight reduction in values, which according to the Real Estate Institute of New Zealand is driven by political and financial issues. Reports suggest the tighter controls on foreign investment have caused a reduction in buyers creating downward pressure on values. Further negative impacts on the sector include increased environmental regulations and the identification of Mycoplasma bovis in cattle in July 2017. Australia tightened restrictions for overseas investors seeking to buy farmland in 2018. This means farmland must now be “marketed widely” to Australian buyers for at least 30 days before it is put on the international market and all overseas buyers must seek approval from the Foreign Investment Review Board. Investors wishing to buy farmland in New Zealand now must apply to the Overseas Investment Office for approval. They must also meet strict criteria, which includes demonstrating substantial and identifiable benefits to New Zealand. Despite this, both New Zealand and Australia score favourably on the Risk Matrix.
NORTH AMERICA
Farmland values in North America and Canada continue to rise, albeit at a slower rate in the past five years. Canada saw an average annualised rise of 9.2% in the last 16 years and 2.4% in the last five years. North America witnessed an annualised increase of 6.1% in the last 16 years and 1.6% in the last five years. North America and Canada both rank high for investment and offer good agronomic opportunities. There are some restrictions for overseas purchasers of farmland in Canada and some states of America have laws banning overseas ownership of farmland.
CENTRAL EUROPE
Hungary, Poland and Romania followed the global pattern of rising values through the 2000s but the rate of growth has subsided in recent years (5.6% annualised in last five years compared to 17.6% in last 16 years). The relative risk of investing in these countries is slightly higher. The rules on overseas investors buying farmland in Hungary is strict and a new law in Poland in 2016 limits farm sizes to 300 hectares. According to a study carried out by the European Parliament around 40% of Romania is now in non-domestic ownership. There are suggestions that the Romanian government is looking at restricting future investment in farmland.
Read the articles within Global Farmland Index below.
.jpg)