First half take-up set to reach over 2.1m sq ft
.jpg)
Year to date take-up at the end of May reached 1.85m sq ft, with an additional 320,122 sq ft completing over the month. Take-up continues to remain well above the long-term average and is currently up 25% on the long-term average. We anticipate take-up for the first half of the year will reach 2.1m sq ft.
.jpg)
GRAPH 1 | West End YTD take-up: sq ft vs volume
Source: Savills Research
Whilst we saw no further pre-letting activity over the month, it has accounted for 27% of leasing activity for the year so far and we expect to see further pre-lets complete with around 350,000 ft of the development pipeline currently under offer.
The volume of transactions completed so far this year, at 157, continues to remain in line with the 10-year long term average amount for this period.
The Insurance & Financial sector continues to account for the largest proportion, over a quarter of transactions that have completed this year. Almost a third of transactions to complete over the month were between 10-15,000 sq ft.
The largest transaction in May was at 64 Victoria Street, SW1, where the Parliamentary Estate took 96,574 sq ft, on the 1st to 9th floors, on a 15-year lease at £63.50 per sq ft. So far this year the Tech & Media sector has accounted for 28% of take-up (471,850 sq ft). We have seen a record level of transactions to the Public sector with 13 transactions completing, three of which have been in excess of 45,000 sq ft. This helped to boost the sectors market share to 18%. Three further transactions complete to Serviced Office Providers, which helped that sector hold its market share at 18%.
So far this year the Tech & Media sector has accounted for 28% of take-up (471,850 sq ft). We have seen a record level of transactions to the Public sector with 13 transactions completing, three of which have been in excess of 45,000 sq ft. This helped to boost the sectors market share to 18%. Three further transactions complete to Serviced Office Providers, which helped that sector hold its market share at 18%.
.jpg)
GRAPH 2 | Transactions volume by sector
Source: Savills Research
Whilst the vacancy rate at 4% has remained at the same level it has been at since the start of the year, we have seen a slight increase in the amount of tenant space in the market which has increased to 33%. Notable tenant space which has been added to supply since the start of the year includes One Carlisle Place, SW1 (41,637 sq ft) and the 2nd floor (29,000 sq ft) at UK House, Great Titchfield Street, W1.
Whilst we were not expecting to see rental growth this year, rental evidence continues to indicate that rents have remained stable, even showing slight growth. The Grade A rent over 2019 is currently £78 per sq ft, this is up 5% on the average Grade A rent achieved over the same period in 2018. The average prime rent at £116.00 per sq ft is also up on the same period in the previous year, 6% above where prime rents stood at £109 per sq ft.
Underlying demand continues to remain resilient and Central London and West End requirements at the end of May was 5.2m sq ft, up 15% on the average amount we have seen over the past year. Space under offer stood was 1.4 m sq ft at the end of the month.
Over the next four years 6.3m sq ft of speculative space is set to be delivered across the West End. Already almost 40% of the pipeline for 2020 has been pre-let and a further 200,000 sq ft is under offer.
Analysis close up
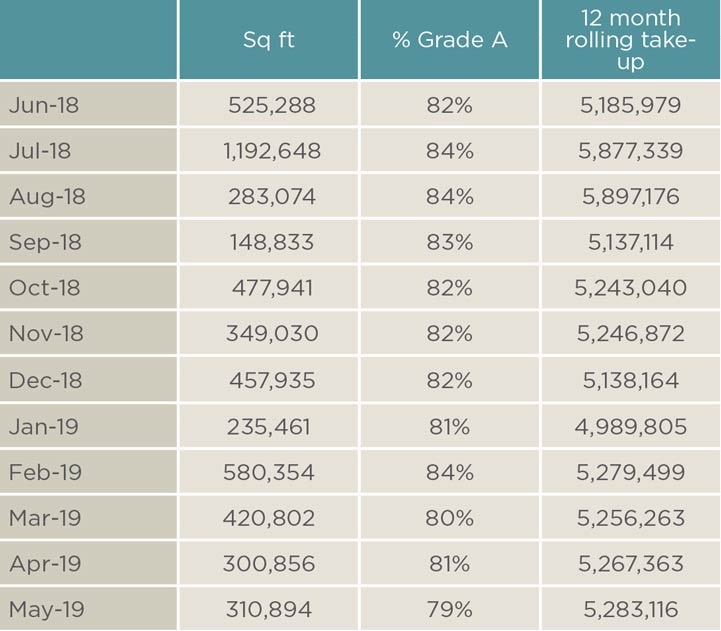
TABLE 1 | Monthly take-up
Source: Savills Research
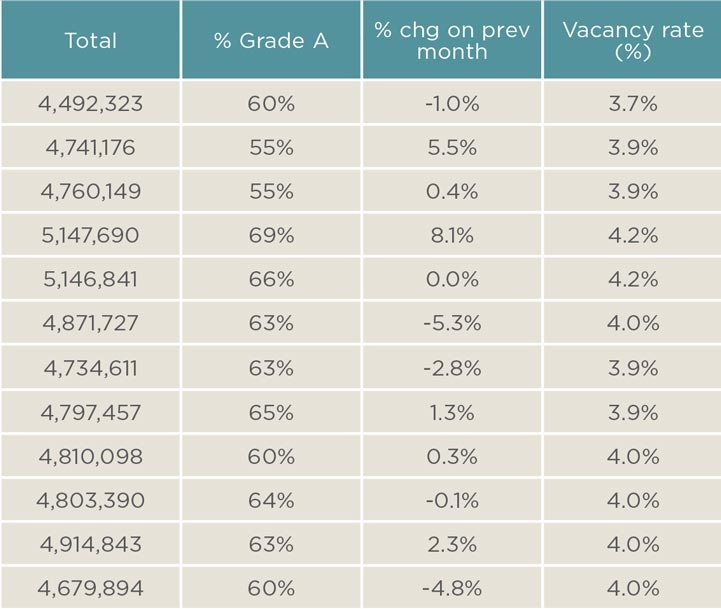
TABLE 2 | Supply
Source: Savills Research
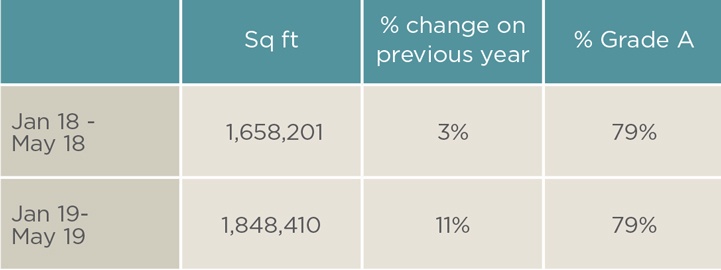
TABLE 3 | Year to date take-up
Source: Savills Research
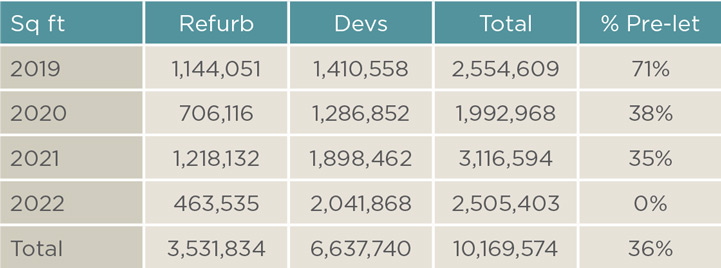
TABLE 4 | Development pipeline
Source: Savills Research
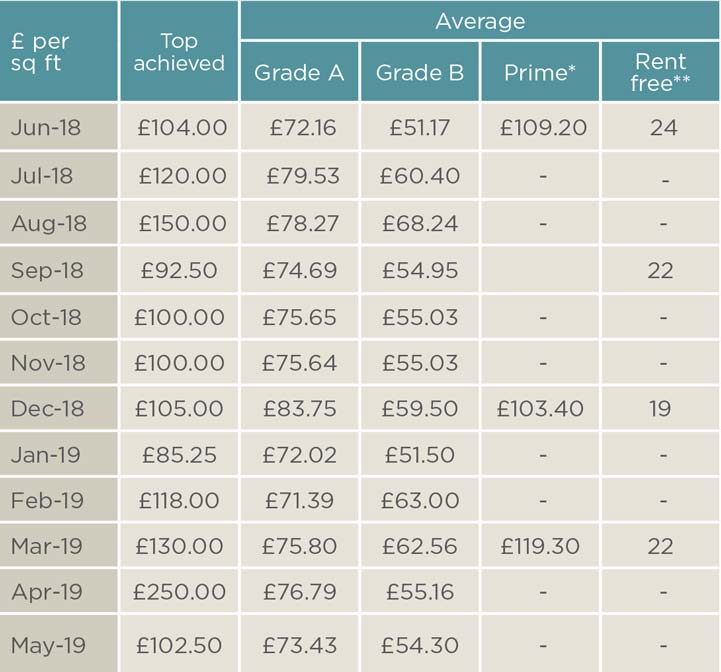
TABLE 5 | Rents
Source: Savills Research
Completions due in the next six months are included in the supply figures
*Average prime rents for preceding three months
** Average rent free on leases of 10 years for preceding three months
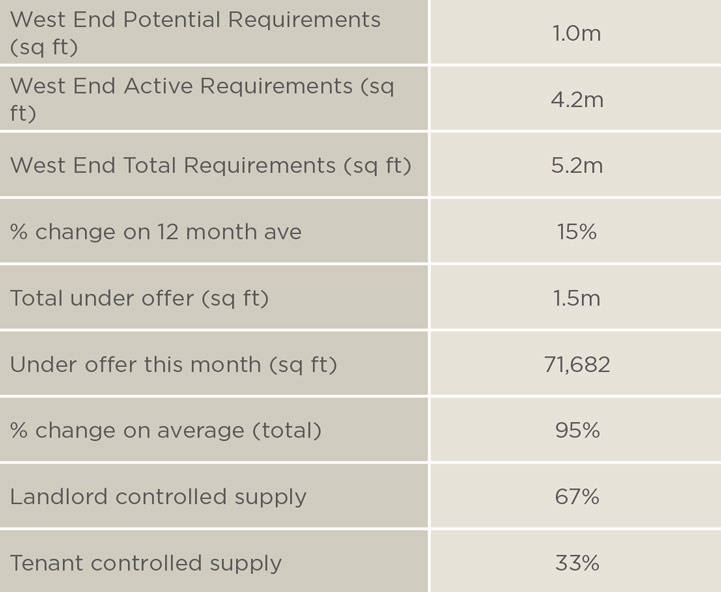
TABLE 6 | Demand & Under Offers
Source: Savills Research
Demand figures include central London requirements
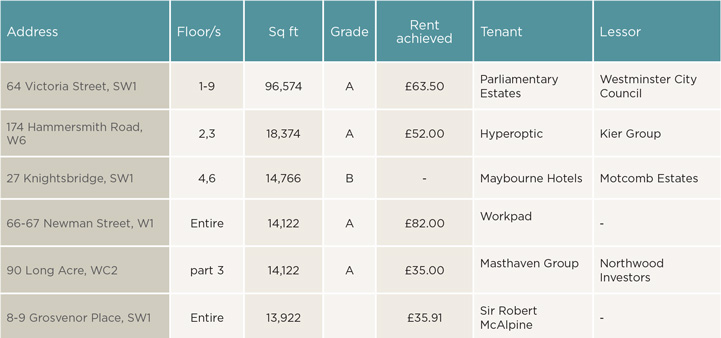
TABLE 7 | Significant May transactions
Source: Savills Research
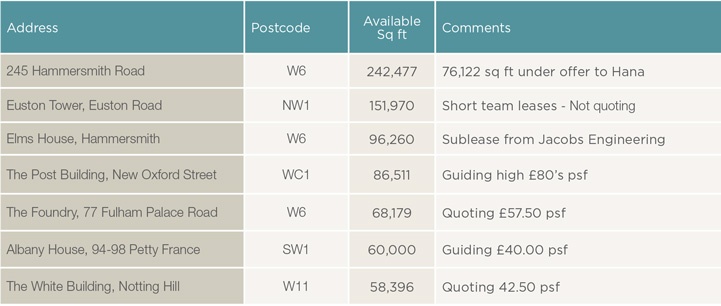
TABLE 8 | Significant supply
Source: Savills Research
.jpg)