
.jpg)
Leasing activity remains strong as active requirements pick-up
Leasing activity remained strong over the month, with 298,543 sq ft completing across 28 transactions, making it the highest amount of space leased in April in over five years. This brought year to date take-up to 1.53m sq ft, up 30% on the long term average for this period and up 12% on 2018.
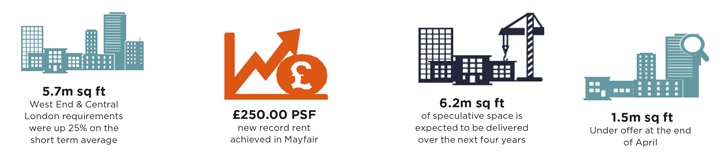
The largest transaction to complete in April was 102,600 sq ft at Derwent’s 1 Soho Place development, where G Research pre-let the upper six floors on a 15-year lease at £95.00 per sq ft. We also saw a new record rent achieved in Mayfair at 30 Berkeley Square, W1 with Steadview Capital taking 2,572 sq ft on part of the 6th floor at £250.00 per sq ft.
.jpg "Graph 1")
GRAPH 1 | West End Januray–April take-up 2010–2019
Source: Savills Research
So far this year the Tech & Media sector has accounted for 30% of take-up (428,821 sq ft), followed by the Serviced Office Provider sector with 19% (262,901 sq ft) and the Insurance & Financial sector with 18% (254,021 sq ft).
Whilst around 60% of transactions to complete during the month were less than 5,000 sq ft, we saw another sizeable transaction complete at WestWorks, White City, W12, with Li & Fung taking the fifth floor (50,431 sq ft) on confidential terms.
As predicted last month, we have seen almost 1m sq ft of additional West End & Central London active requirements launched during the month which has largely been as a result of upcoming lease expiries. In total, demand stood at 5.7m sq ft and was up 25% on the annual average and at its highest point in over 16 months.
While the size-bands of current requirements are fairly evenly spread, requirements for space between 25–50,000 sq ft makes up a quarter of current Central London and West End requirements (see Graph 2).
.jpg "Graph 2")
GRAPH 2 | West End & Central London requirements
Source: Savills Research
Space under offer also continued to increase over the month and stood at 1.5m sq ft at the end of April. The most notable space under offer in April was approx 100,000 sq ft at 64 Victoria Street, SW1 which has since exchanged.
Supply at the end of the month stood at 4.9m sq ft, which equates to a vacancy rate of 4.0%. Over 85% of the floors that are currently available across the West End are less than 10,000 sq ft. There are around 45 floors which could accommodate a single floor requirement over 15,000 sq ft, half of these are located in Hammersmith.
The vacancy rate has remained at the same level over the last three months and equates to around 11 months of take-up at the rate we have seen over the last year. We expect supply will continue to remain at the same level over the next year, before moving out by 30 bps to 4.3% during 2020.
An additional 823,838 sq ft of extensive refurbishments and developments have been scheduled for 2022 since the start of the year. This brings the total pipeline for the next four years to 10.1m sq ft. Already 36% of this has been pre-let which leaves 6.2m sq ft of speculative space to be delivered. A further 1.5m sq ft has so far been scheduled for 2023.
Analysis close up
.jpg "Table 1")
TABLE 1 | Monthly take-up
Source: Savills Research
.jpg "Table 2")
TABLE 2 | Supply
Source: Savills Research
.jpg "Table 3")
TABLE 3 | Year to date take-up
Source: Savills Research
.jpg "Table 4")
TABLE 4 | Development pipeline
Source: Savills Research
.jpg "Table 5")
TABLE 5 | Rents
Source: Savills Research
Completions due in the next six months are included in the supply figures
*Average prime rents for preceding three months
** Average rent free on leases of 10 years for preceding three months
.jpg "Table 6")
TABLE 6 | Demand & Under Offers
Source: Savills Research
Demand figures include central London requirements

TABLE 7 | Significant April transactions
Source: Savills Research
.jpg "Table 8")
TABLE 8 | Significant supply
Source: Savills Research