
.jpg)
The West End sees strongest Q1 take-up in over six years
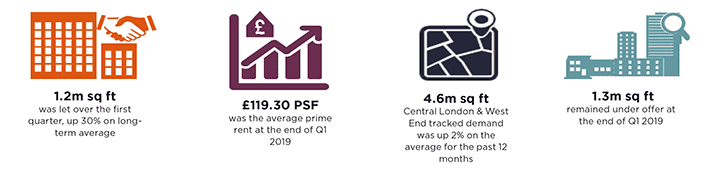
Leasing activity across the West End continued to remain resilient over the first quarter of this year, amidst the continued uncertainty, with occupiers remaining undeterred and pushing forward to complete on 98 transactions. Overall 1.2m sq ft completed making it the highest amount of take-up we have seen over the first quarter in over six years, and up 30% on the long-term average.
.png "Graph 1")
GRAPH 1 | West End Q1 take-up 2000–2019
Source: Savills Research
In March we saw 429,750 sq ft complete across 42 transactions, the vast majority of which were across core West End sub-markets. The largest transaction to complete this month was Glencore’s acquisition of the 2nd to 4th floors at Great Portland Estate’s 18-19 Hanover Square, W1, (52,691 sq ft), on a 20-year lease at £116.00 per sq ft. The other notable transaction to complete this month was at Derwent London’s Brunel Building, W2, with Splunk pre-letting the remaining three floors, on a 12-year lease at £74.50 per sq ft. The Brunel Building is now fully pre-let ahead of its anticipated completion in Q2 2019.
The Tech & Media sector continues to account for the largest share of take-up for the year so far, at 25%, while the Insurance & Financial sector and the Serviced Office Provider sector both followed, each with a 21% share. The volume of transactions to Financial sector occupiers has continued to be a key driver of leasing activity, accounting for a quarter of transactions so far this year.
Albeit the sample size of data on a quarterly basis is smaller, the increased competition to secure the best space, in light of the increasing awareness occupiers have of the West End’s supply constraints, and the higher level of upcoming lease events, is beginning to reflect on rents in certain sub-markets. Whilst we are not expecting to see rental growth this year, evidence suggests prime rents remain stable, with the average prime rent standing at £119.30 per sq ft, up 13% on Q1 2018. This is the highest average prime rent we have seen since the end of 2017.
.png "Graph 2")
GRAPH 2 | Average prime rents by quarter
Source: Savills Research
Supply remained at 4.8m sq ft and the vacancy rate at 4.0%. The most notable new addition to supply was 245 Hammersmith Road, W6 (242,447 sq ft), which is expected to complete in Q3 this year.
We anticipate supply will remain broadly at the same level over the next year, with 70% of the space which is scheduled for delivery over 2019 already pre-let. The majority of the speculative space expected to be delivered over the coming year has already been accounted for in our supply figures (which takes into account space which is expected to complete over the next six months). This leaves only an additional 27,081 sq ft of speculative space at Embassy Gardens, SW8, which is expected to be delivered in the final quarter of this year.
Both space under offer and office requirements remain above their long-term averages at 1.3m sq ft and 4.6m sq ft, respectively. We expect West End and Central London requirements to increase over the second quarter, with a number of prominent financial occupiers launching searches in advance of upcoming lease expiries and we have already seen 300,000 sq ft of additional Central London requirements reported since the start of April.
Around half of the West End & Central London requirements are for space between 10,000–20,000 sq ft, and just over a quarter of requirements are for Tech & Media sector occupiers. With market fundamentals remaining positive, we expect take-up this year will be well above the long-term average with occupiers continuing to remain committed to being in the West End.
Analysis close up
.png "Table 1")
TABLE 1 | Monthly take-up
Source: Savills Research
.png "Table 2")
TABLE 2 | Supply
Source: Savills Research
.png "Table 3")
TABLE 3 | Year to date take-up
Source: Savills Research
.png "Table 4")
TABLE 4 | Development pipeline
Source: Savills Research
.png "Table 5")
TABLE 5 | Rents
Source: Savills Research
Completions due in the next six months are included in the supply figures
*Average prime rents for preceding three months
** Average rent free on leases of 10 years for preceding three months
.png "Table 6")
TABLE 6 | Demand & Under Offers
Source: Savills Research
Demand figures include central London requirements
.png "Table 7")
TABLE 7 | Significant March transactions
Source: Savills Research
.png "Table 8")
TABLE 8 | Significant supply
Source: Savills Research