Pricing is key for competing interest
On average, prices in the prime regional housing markets remained relatively flat, falling by just 0.6% in the third quarter of 2018. This reflects a general lack of urgency from prospective buyers, primarily stemming from the uncertainty surrounding both the Brexit negotiations themselves and what it will mean for the economy.
Annual house price movements are now in low single-digit negative territory across southern England. That reflects a lack of impetus from a subdued prime London market, which has borne the brunt of successive increases in stamp duty. Markets beyond this – which have been less directly impacted by high stamp duty costs and are less reliant on equity flowing out of the capital – have continued to show low levels of annual house price growth.
The prime market of Edinburgh, where prices have risen by 6.5% in the past year, has shown the strongest performance. Properties in other prime urban markets – such as Cambridge, Bath, Winchester and York – are no longer showing higher house price growth than those in village and rural locations, as the whole market has become more price sensitive.
That means realistic pricing is key to generating competing interest and a successful sale at the best price.

Price movements In the prime regional housing markets (to September 2018)
Source: Savills Research
Stamp duty receipts rise
On 28 September 2018, HMRC published its detailed figures for stamp duty receipts for 2017/18. They showed that receipts from property worth more than £1 million totalled some £2.9 billion. That is £1 billion more than in 2013/14 (the last fiscal year before the stamp duty overhaul of December 2014). Days later, Theresa May also announced unexpected proposals for a further stamp duty surcharge on non-UK resident buyers of between 1% and 3% of a property’s purchase price (though this is more relevant to the central London market).
Price Monitor
.png)
Key statistics for house price growth
Source: Savills Research

To the manor born
Price movements of prime property have not only varied by location over the past five years, but also by property type. Over that time, there has been little, if any, net price growth for manor houses, leaving them looking increasingly good value. Rectories and farmhouses have seen net price growth of 6.4% and 7.8% in this period.
Among all rurally located properties, only more modest cottages have kept pace with prime properties in urban locations, with values up by more than 15% over five years.
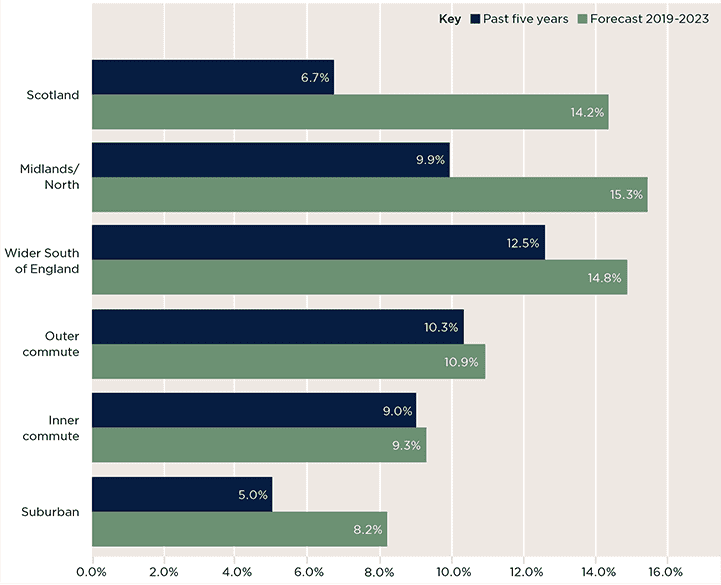
Prime regional prices
(Past performance compared with future forecasts)

Source: Savills Research
Outlook
We expect current market conditions to continue during Brexit negotiations, in the run up to March 2019 and the anticipated period of transition thereafter. Despite the prospect of gradually increasing interest rates and the general election slated for 2022, we forecast gradual improvement in price growth from 2021. This assumes an orderly Brexit and no major changes in domestic politics.
Having already absorbed the stamp duty increases seen since 2014, we believe price growth will be a little higher over the next five years, compared with the last. The relative value in most regional housing markets (compared with the more domestic markets of prime London) is likely to underpin modest price growth in the commuter zone. But, with the amount of equity generated in the capital being constrained, we also expect higher growth beyond these areas, as we move to the next stage of the housing market cycle.
.png)
Source: Savills Research | Note: These forecasts apply to average prices in the secondhand market. New build values may not move at the same rate
.png)