Underlying demand remains strong with space under offer at its highest point in over a year
Supply and demand snapshot
- Take-up in May reached 283,413 sq ft across 38 transactions. This brought total take-up to 1.62m sq ft, up 9% on the long-term average and 11% up on the same period last year.
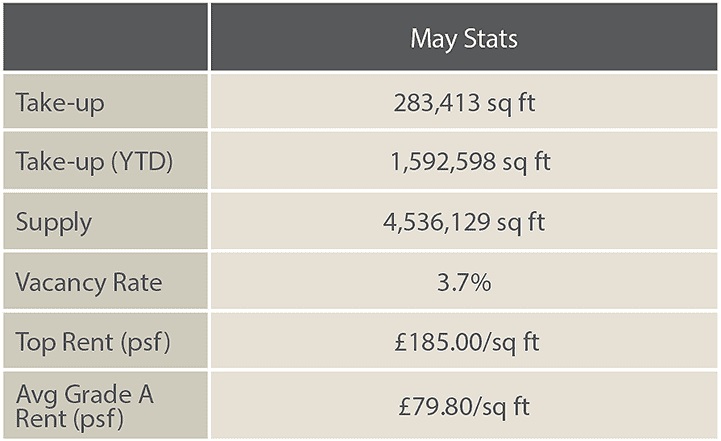
TABLE 1 | Key May stats
Source: Savills Research
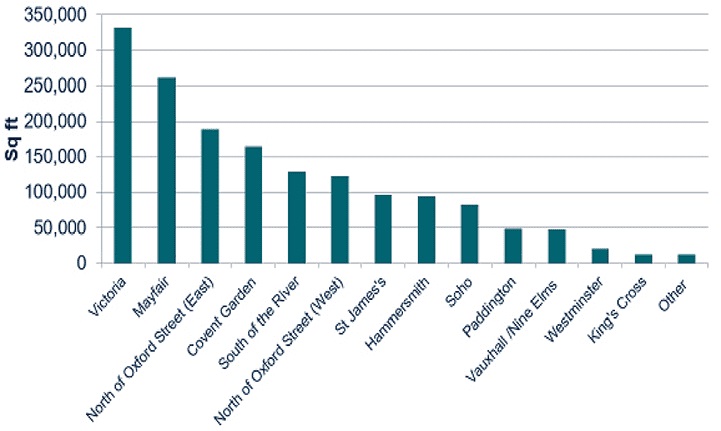
- Mayfair was the most active submarket over the month, accounting for 31% of overall take-up. The largest transaction to complete was at 1 Curzon Street, W1 with Houlihan Lokey taking an assignment of the part 3rd floor & 4th floor leases (42,811 sq ft), on confidential terms.
- Another notable transaction in Mayfair was at Park House, 116 Park Street, with London Executive Offices taking the 7th & 8th floors on terms which also remain confidential.
GRAPH 1 | Take-up by sub-market (YTD)
Source: Savills Research
- This month the highest rent recorded since March last year was also achieved, with OCI taking the 5th floor at 30 Berkeley Square, W1 on a 10-year lease at £185 per sq ft.
- There have been seven transactions with rents of £100 per sq ft or greater, equating to just 8% of year-to-date transactions, compared to 15% of transactions for the same period in 2017.
.png)
GRAPH 2 | No of transactions by rent-band (sq ft)
Source: Savills Research – May 2018
- Once again space under offer continued to increase demonstrating underlying demand remains strong despite the slow pace of transactions so far this year.
- In total over 1.8m sq ft of space was under offer at the end of May, 33% of this is to Tech & Media occupiers and a further 15% is believed to be to Serviced Office Providers. The amount of space under offer of current supply is at its highest level since May last year.
- The Insurance and Financial services sector dominated overall take-up over the month with a 40% market share, off the back of five transactions. This was followed by the Serviced Office Provider sector (35%) and Tech & Media sector (14%).
- Supply continued to decline, 10 bps on the previous month to 4.53m sq ft, equating to a vacancy rate of 3.7%. 60% of current supply is of Grade A standard.
- The Victoria sub-market experienced the most notable reduction in supply since the end of the first quarter. Victoria has accounted for 20% of year-to- date take-up, and supply in this submarket has fallen from 500,420 sq ft to 318,354 sq ft, (equating to a vacancy rate of 4.3%).
- Of the 4m sq ft of the developments and extensive refurbishments set to complete in the West End between 2019 and 2020, 1.1m sq ft (28%) has already been pre-let, and an additional 0.37m sq ft (9%) is currently under offer.
Analysis close up
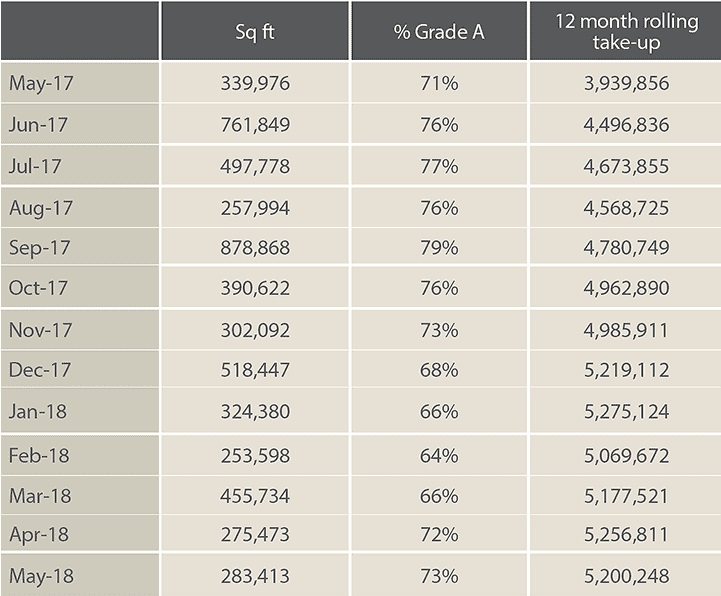
TABLE 2 | Take-up
.jpg)
TABLE 3 | Supply
.jpg)
TABLE 4 | Rents
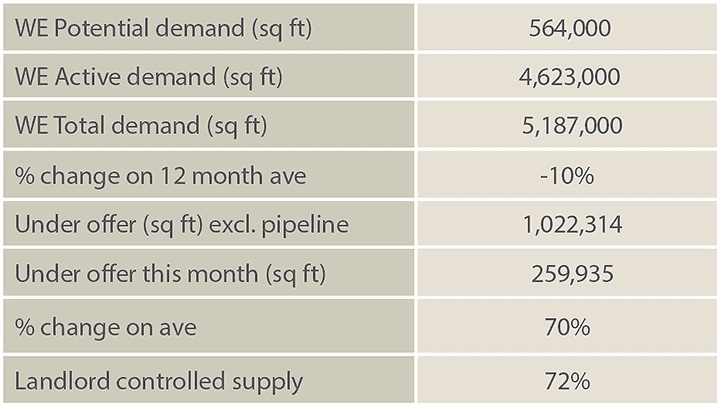
TABLE 5 | Demand & under offers
Demand figures include central London requirements
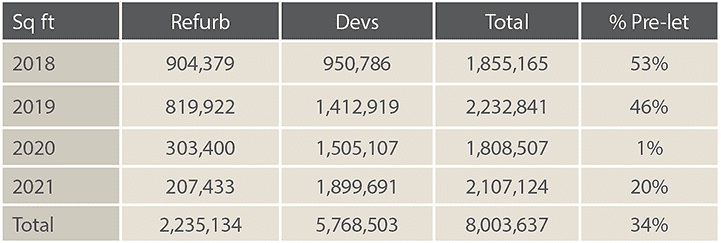
TABLE 6 | Development pipeline
Completions due in the next six months are included in the supply figures
* Average prime rents for preceding three months
** Average rent free on leases of 10 years for preceding three months
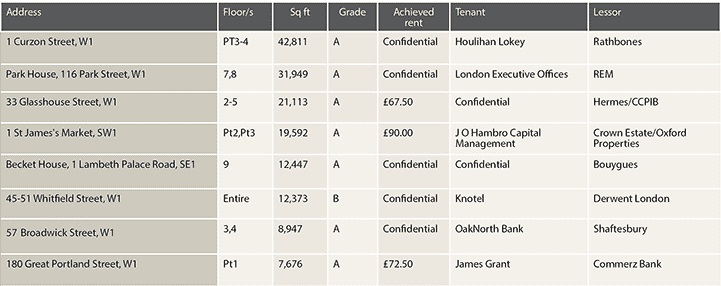
TABLE 7 | Significant May transactions

TABLE 8 | Significant supply