Evolution, current situation and prospects for the sector
■ The retail warehouse sector in the UK has, according to MSCI, delivered the strongest annual rental and capital value growth (4.3% pa and 4.6% pa respectively) of any commercial property sector over the period 1980–2017.
■ This report examines how the sector evolved, why it has delivered an average total return of 11.5% pa over the last 37 years, and whether that out-performance will be sustained in the future in the face of the structural change that is sweeping retailing across the world.
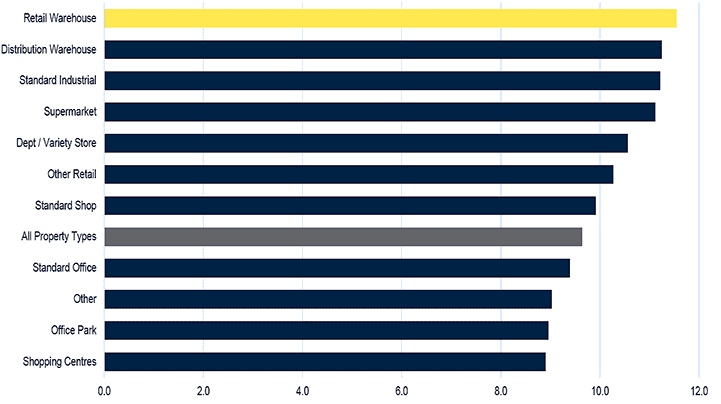
GRAPH 1 | Average annual total return (1980–2017) % pa
Source: MSCI/IPD
Evolution of the sector
■ The development of the first generation of retail warehousing in the 1980s was driven primarily by the needs of the bulky goods and DIY retailers. While a few general merchandise retailers such as Matalan were early adopters, the early schemes were viewed as the domain of large, low cost space users on the outskirts of towns and cities.
■ Solus units or small clusters were more common than parks, and in many cases these were conversions of industrial and car showroom space.
■ The retailer's rationale for supporting this new segment of the market was straightforward - rents on the high street had been rising sharply, and there was a limited supply of retail units in excess of 10,000 sq ft in these locations.
■ From these fairly humble beginnings the sector started to evolve fast, and the first retail parks emerged in the mid 1980s. These parks tended to be anchored by a very large DIY or bulky goods retailer, with an increasing variety of other retailers also seeing the attraction of the marked rental discount to the high street in what was usually a highly visible roadside location with free parking.
■ The spread of units sizes on offer started to widen as retail parks began to be developed, though it remained firmly in excess of 15,000 sq ft. More excitingly for shoppers, these new parks started to include restaurants, cash machines and toilets!
■ The strong tenant demand for this new trading location in the late 1980s caught the supply-side by surprise, and consequently rents started to rise sharply. Between 1985 and 1990 the average annual rental growth in the sector was 11.3% per annum.
■ With these levels of rental growth, and the consequent high total returns, it is no surprise that developers and investors swung into action and started to develop new schemes. We estimate that the stock of retail warehousing in the UK more than trebled between 1985 and 1995.
■ However, demand still exceeded supply, and rental growth throughout the 1990's was well ahead of other commercial property sectors, averaging 4.6% pa across the decade.
■ In the late 1990s the concept of the shopping park started to emerge. These parks with a more open planning consent proved attractive to general merchandise and fashion retailers, with the early successes being schemes like Fosse Park, Fort Kinnaird and the Fort. Typically, while they were of a similar size to bulky parks, they offered a wider variety of units sizes down to 5,000 sq ft or below.
■ Once again the factor that attracted more traditional high street retailers to the shopping parks was their low rents, in many case 50% lower than the equivalent local high street.
■ The arrival of high street retailers onto retail warehouse parks started to move the shopping park to a more mall-like offering. New schemes included restaurants and associated facilities that were designed to increase shopper dwell-time. Landscaping and design also started to improve, with this third generation of retail warehouse schemes bearing no resemblance to their 1980s forebears.
■ Of course more facilities on shopping parks led to higher costs to the tenants, whether in terms of rents or service charges. However, the imbalance between supply (in part due to the change to planning policy that was introduced in the late 1990s that discouraged out-of-town retail development) and demand continued to drive strong rental growth, with the sector showing an average annual rental growth of 5.4% pa between 2000 and 2006.
■ The evolution of the shopping park (and the very attractive returns that the wider sector had been delivering) significantly broadened the ownership of the sector in the early 2000s. Prior to that the developers and owners of retail warehousing had been limited to a handful of specialist property companies and one or two institutions.
■ Increasing interest in the sector, particularly from domestic institutions, led to investment turnover rising from £1.5bn in 2000 to over £4.5bn in 2006 (Graph 2).
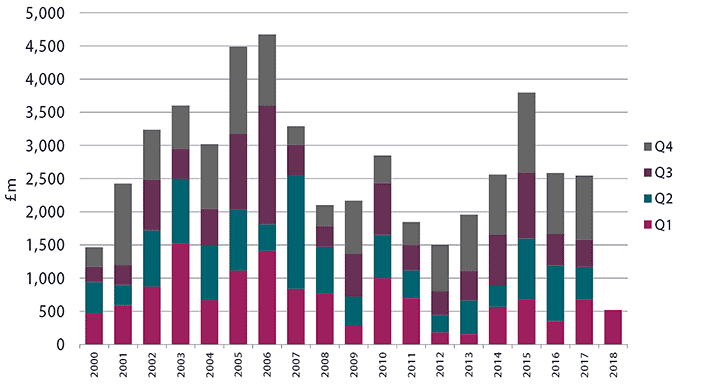
GRAPH 2 | Retail warehouse investment turnover (£m)
Source: Savills Research
■ 2005–06 represented a bit of an inflexion point for the sector, with the vacancy rate trending upwards from below 6% to nearly 12% by 2009. This was caused by a combination of administrations, receiverships and tenant returns as tenants sought to save costs or improve margins in the face of a weakening macro-economy.
.png)
GRAPH 3 | All retail warehousing vacancy rate (%)
Source: Savills Research, TW Research
■ As the global financial crisis (GFC) segued into a consumer downturn the vacancy rate remained high in the sector, though some segments (most notably value-orientated retailers) remain actively acquisitive. In common with the rest of the UK commercial property market development activity in this sector fell back to record low levels, and it was this that set up the market for the steady falls in the vacancy rate that have been seen since 2012.
■ While the vacancy rate in the sector has recovered strongly since the GFC, the same is not true of its investment performance. While the average annual total return since 2010 has been a respectable 7.7%pa, for the first time in the sector's history it has under-performed the All Property return of 10.2% pa.
■ Rental growth has been weak (0.5% pa), and capital value growth has also been weaker than normal (1.7% pa). So, what has changed over the last decade to move the segment from being an out-performer to an under-performer?
■ The first, and most obvious, reason is that other sectors have become more popular. Distribution warehouse returns for example averaged 11% per annum prior to the GFC, and have averaged more than 15% per annum over the last five years. Clearly this has much to do with investor's perceptions that retail property is being negatively affected by internet shopping, while industrial property is benefitting from it.
■ This re-weighting has been fairly unselective, with all of retail falling out of favour and consequently delivering lower capital growth. This is a topic that we will return to in the next two sections of this report.
■ The second reason for this period of weaker performance was that in many cases the rental differential between retail warehouse parks and their local high street was no longer as persuasive as it was in the first twenty years of the sector's evolution. Rents, particularly on the best shopping parks, were driven up by strong tenant demand, and then as the post GFC recession hit, landlords on high streets and in shopping centres were quicker to cut rents than those on parks.
■ By late 2010, retailer demand started to recover for prime parks in the UK, with demand coming both from the traditional occupiers such as Dreams, Pets at Home and Halfords, as well as renewed interest from high street retailers such as Debenhams, Gap and New Look. Once again, the flow of retailers from the high street was driven by a shortage of suitable sized units on the high street, as well as rising rents.
■ Finally, the last five years have also seen the rise of the discount retailer both on high streets and out-of-town. These retailers, both in general merchandise and food, have been significant acquirers of retail warehouse space and have helped drive the vacancy rate down to record low levels. However, their low price model means that their margins are thin, and thus while activity has been robust their willingness to pay higher rents has been muted.
■ The last five years have also seen an increasingly diverse group of buyers investing in the sector (Graph 4). Proportionately speaking 2017 saw the lowest ever level of activity by property companies. However, this gradual decline has been balanced out by steadily rising investment in the sector from private investors, non-domestic investors, and retailers themselves.
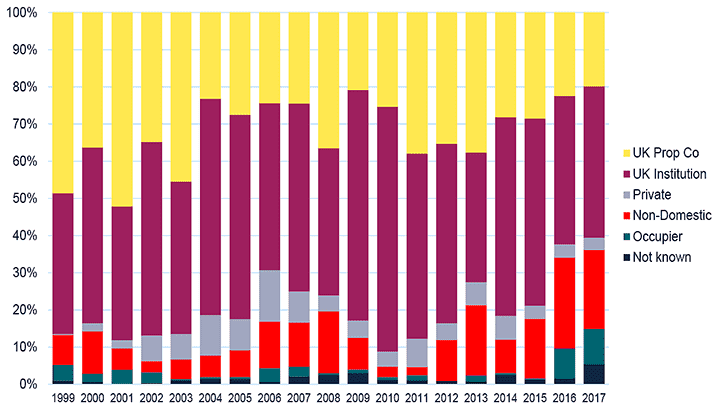
GRAPH 4 | Retail warehouse investments - purchaser type
Source: Savills Research
Where are we now?
■ Our retail publications in 2017 made for pretty depressing reading, as a perfect storm of rising costs and weak sales growth hammered retailer's margins.
■ These shocks (many of which were Brexit-related) combined with the structural change of internet shopping to create one of the worst years for UK retail that we can remember.
■ Some of these hits were one-offs (e.g. the sharp weakening of sterling in 2016/17), and others are more pervasive (rising minimum wages and internet shopping penetration). The combination of them however has led to a flurry of retailer failures and CVAs in the first half of 2018. Indeed, against this negative background even those retailers who were in an expansionist frame of mind at the start of the year are now taking stock in case better units in better locations become available as a result of someone else's pain.
■ What is important to remember is that poor performance of many UK retailers says more about how bad 2017 was than it does about the future. Indeed, as we examine in the next section of this report the future is definitely looking brighter for some parts of retailing at least.
■ On the macro-economic side of the equation the best news for UK retail is that real earnings growth is back into positive territory for the first time in over a year. With CPI in the year to April 2018 only rising by 2.2% against wage growth of 2.8%, the implied growth in real earnings may not be dramatic, but its better than a fall!
■ So, while wage growth has remained stubbornly weak for all of the post-GFC period (despite record levels of employment in the UK), it is once again rising faster than prices.
■ This should feed through into improving consumer confidence over the summer, and bodes well for retailer trade around Christmas 2018.
■ Consumer confidence is particularly confused at the moment, with the overall GfK measure showing that the British consumer's normal state of mild pessimism is in place at the moment. However, the same survey also shows that people's perceptions of the outlook for their own financial situation is almost at its highest level since 2007.
■ Other measures, such as the level of unsecured borrowing and saving that people are doing also point to a far more optimistic picture than some consumer surveys numbers are indicating.
■ Of course improving consumer confidence and indeed spending is not hugely comforting for retailers and their landlords if more and more of that spend is being diverted to internet shopping and just benefitting logistics operators and landlords.
■ The UK population has embraced internet shopping with more enthusiasm than the shoppers in any western nation. The latest official statistics show that 16.4% of all retail sales in the UK were online in February 2018. This is a dramatic rise from the 5% penetration a decade ago.
■ However, as Graph 5 shows, the rate of growth in internet sales has nearly halved over the last 12 months. While it may be too early to argue that a plateau has been reached, we do believe that the evolution of the retail offer from "bricks versus clicks" to "omnichannel" has now happened.
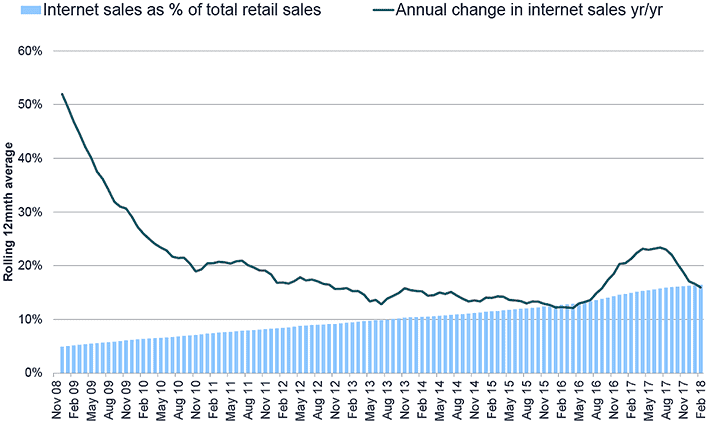
GRAPH 5 | Internet sales in the UK
Source: Office for National Statistics
■ With pure play internet retailers increasingly seeing the value of having their own stores the story cannot be as simple as saying the rise of internet shopping equals a need for fewer stores. With 84% of retail sales still happening in store, and 89% (according to GlobalRetail) touching the store in some way, maybe the outlook is more positive than it seems.
■ Many of those who were predicting a few years ago that the online sales would rise to 40% or 50% of total sales were basing this projection on the premise that online retail is more profitable than the shop-based alternative. However, very little evidence exists to support this view.
■ While the cost of operating a website is undoubtedly lower than that of operating a store network, delivering the products that people order online is expensive if those customers are not prepared to pay the real delivery price. The fact that even Amazon makes a loss in terms of what people pay them for delivery and what it costs them to fulfil it says that this is by no means an easy win for retailers. Indeed, a recent report by Canaccord Genuity estimated that Asos did not make a profit in the UK because of high costs and high levels of returns.
■ The challenge for retailers in the next decade will be to either persuade customers to pay the actual cost of delivery and returns, or to encourage them to pick the product up and return it to a convenient location – say for example a shop!
■ As far as the challenge from the internet goes we have long been a believer that retail warehousing is more defensive than more traditional high street or shopping centre retail. This view is supported by the data in Graph 6 that shows that penetration is lower in the type of goods that are typically sold on retail warehouse, particularly on bulky goods parks. Strong high streets will continue to be popular with shoppers for repeat visits and convenience goods, so long as their offer fits their catchment (the same being true for shopping centres of all types).
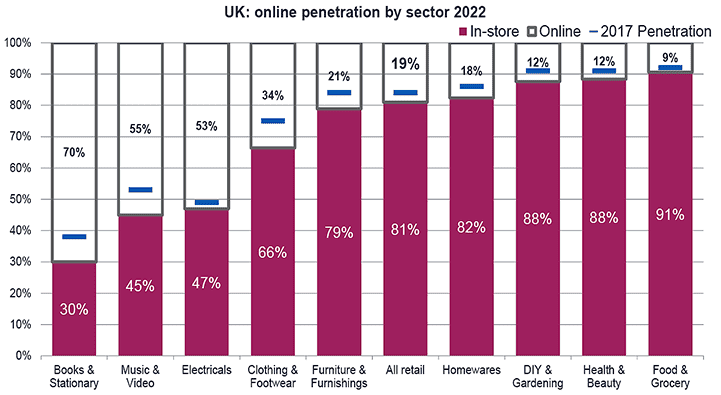
GRAPH 6 | Internet penetration by type of product
Source: GlobalRetail
■ This view is borne out by the tone of tenant demand that has been present in the market for the last two to three years, with occupational demand from bulky goods retailers consistently being far stronger than that from general merchandise and clothing retailers.
■ We also believe that retail warehousing is more 'internet friendly' in that it offers large stores that are suitable to display a full product line, and are better placed to service click and collect and returns.
The future
■ The most immediate question around the outlook for retail warehousing is around the impact of the recent surge in administrations and CVAs on the vacancy rate.
■ Voids on retail parks will undoubtedly rise due to the failures of Maplin, Toys R Us and the CVA at Carpetright. However, if we assume that only 20% of these units are re-let by the end of 2018 (very much a worst case scenario), this only takes the overall retail warehouse vacancy rate from 5.96% to 7.82%.
■ On a square foot basis the impact on vacancy rates is even lower, with the worst case scenario being a rise from 3.62% to 5.17%.
■ To put these figures into context the latest MSCI UK vacancy rate for offices is 12.35%.
■ Whatever the eventual out turn might be for retail park vacancies, the short term impact will definitely be on decision-making. Weaker retailers will be looking closely at expansion plans, and stronger retailers will be looking to do more opportunistic deals.
■ The rationale for opportunism is twofold. Firstly, there might be the opportunity for a retailer to achieve better terms in a few months time than today. Secondly, some acquisitive retailers will definitely be speculating as to whether better units might come to the market as a result of these failures, and will want to keep some of their purchasing power in reserve to spend on these new units.
■ It is also relatively obvious, but still worth noting, that one retailer's failure is another's gain. So, Tapi will benefit from Carpetright's downfall and B&Q will benefit from Bunnings' withdrawal etc.
■ We also believe that the fundamental drivers of retail spending, and particularly spending on retail warehouse goods are going to improve. Low unemployment and rising real wage growth should stimulate consumer confidence and hence spending (albeit against a background of rising interest rates, that will affect those with mortgages and unsecured borrowing).
■ As we have explored in the previous section of this report, sales of retail warehouse-type goods have been less affected by internet shopping than general merchandise and clothing goods (Graph 6). This trend is expected to continue, and Graphs 7 and 8 shows the projected annual average growth in sales of retail warehouse type goods.
■ Graph 7 in particular emphasises our view that the factors that caused this sector to boom in the 1990s (ie cheap rents and large units), will support its continued growth through the internet shopping era.
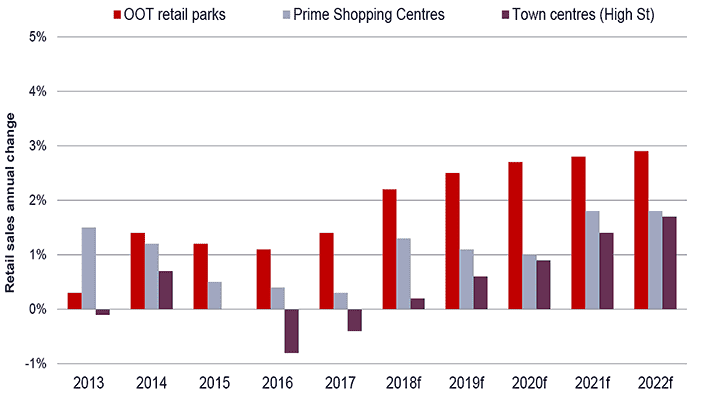
GRAPH 7 | Projected growth in retail sales by destination
Source: GlobalData
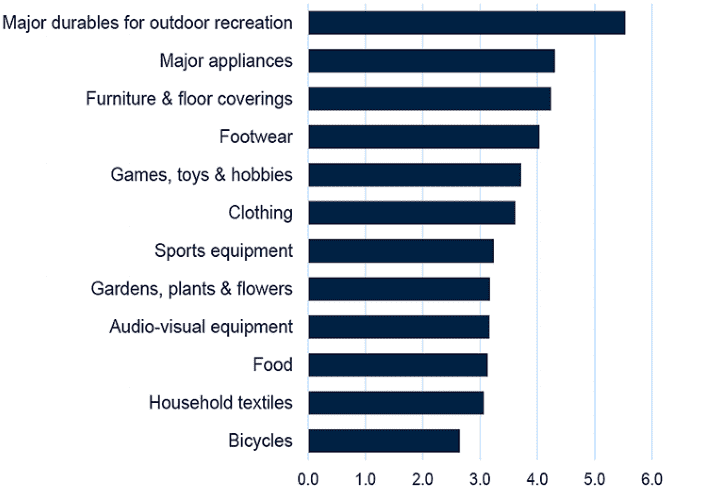
GRAPH 8 | Projected % pa growth in sales of RW type goods (2018-2022)
Source: Oxford Economics
■ While we expect this comparative resilience and lower cost to retailers to support both consumer spend and tenant demand, the fact still remains that the UK is generally over-retailed. This will mean that retailer demand will be even more focused on the best locations for that brand.
■ Indeed, we believe that a retail location's fit to its catchment will be the new definition of "prime" rather the age or look of a scheme. This will mean that dominant schemes of all types will trade well, regardless of whether they are offering the shopper 'experience' or 'convenience'.
■ The retail warehouse investment market is already pointing to an increasing divergence in pricing between prime and secondary schemes and locations (Graph 9), and we expect this trend to continue in the short term. However, traditional definitions of prime may be less applicable going forward.
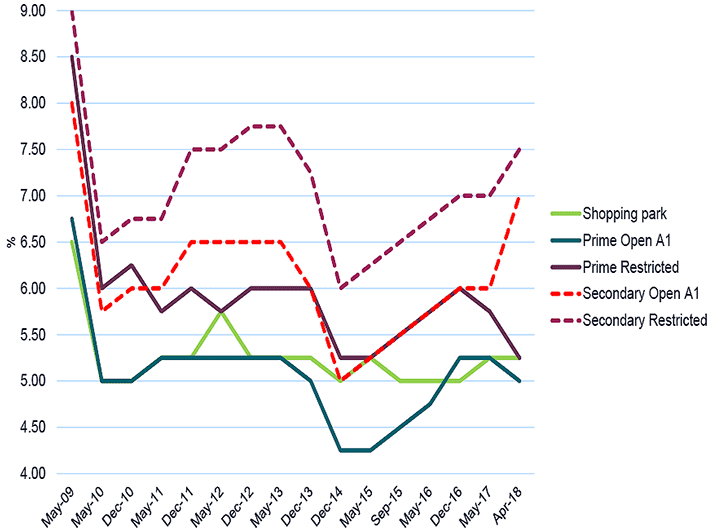
GRAPH 9 | Retail warehouse yields by type of scheme
Source: Savills Research
■ The investment market is also showing a degree more confidence at the moment in retail warehousing than other segments of retail, with the Q1 2018 volume of investment traded in this sector only being 20% down on the five year average for the same quarter (as supposed to unit shops which were 38% down, and shopping centres which were 73% down).
■ One forward challenge that is relatively unique to the retail warehouse sector is the volume of lease expiries that will be occurring over the next few years. Because this is a relatively new asset class and the bulk of the early leases were for 15 or 20 years, the period 2019-2022 will see a higher than normal number of lease events.
■ We estimate that just over 3,400 leases will either expire or reach a lease break over the next five years, and this raises the question as to what degree is over-renting a feature of the retail warehouse market.
■ MSCI estimate that as of March 2018 37.3% of retail warehouse leases are over-rented, and 27.2% are under-rented. While the level of over-renting is ahead of the UK All Property average of 25%, it is broadly in line with UK shopping centres (32.5%), and standard retail outside the South East (38.1%).
■ This degree of over-renting, when combined with the impending spike in lease events, does imply that some retail warehouse locations will see rental falls in the next few years.
■ However, as Graph 10 shows, both Real Estate Forecasting and the IPF consensus of brokers and fund manager's forecasts are pointing to positive average annual rental growth for the sector over the next five years.
■ More dominant schemes that fit their catchment well will outperform these average, delivering 1.5%–2% pa over the same period.
■ Rental growth will undoubtedly be weaker in the early part of this five year forecast period. However, the recovering retail economy, and the attractions of the asset class to retailers who are struggling with structural change, is expected to deliver stronger rental growth in 2020 and 2021.
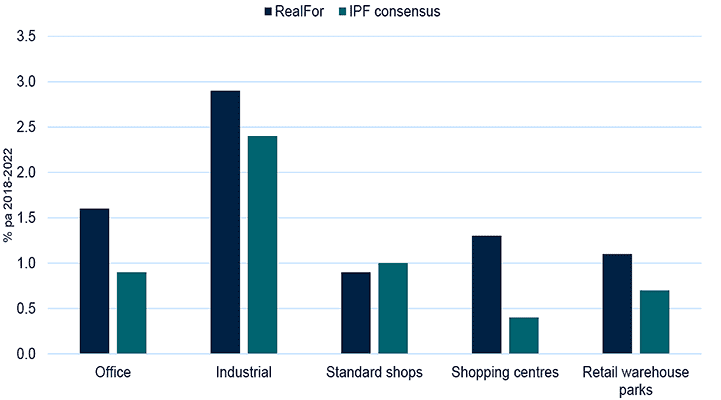
GRAPH 10 | Forecast average annual rental growth (2018-2021)
Source: Real Estate Forecasting Ltd, Investment Property Forum
Conclusions
■ Retail warehousing has been the best performing commercial property segment in the UK over the period 1980- 2017, delivering an average annual total return of 11.5% pa).
■ The sector evolved in the 1980s and 1990s to satisfy retailer's needs for units that were larger and lower rented than the traditional shops that were available on high streets and in shopping centres.
■ While the retail warehouse segment in the UK is by no means immune to the structural change of internet shopping, we believe that it is the most defensive segment of retail.
■ Retailers who are experiencing pressure on their margins from rising costs or leakage to pure play internet retailers will once again find the lower rents that are on offer on many retail warehouse parks attractive.
■ In particular, we expect bulky goods tenant demand to be sustained and focused on retail warehouse parks. Demand from other product categories will be supported by the lower rents and the ease of satisfying click and collect and internet-sourced returns.
■ While the total returns over the next five years will not match those of the last 37 years, they will exceed those on offer from the rest of the retail property market.
Glossary:
Bulky goods parks: schemes that are only allowed to sell certain goods such as carpets, electricals, DIY and furniture. Also known as "restricted consent".
Open A1 parks: schemes that are allowed to sell the majority of goods (including fashion). Also known as "shopping parks".
Planning policy: Planning Policy Guidance notes (PPG) 6 and 13 provide guidance to local authorities in the UK on how to use planning powers to limit the impact of out-of-town retail schemes on town centre retail, and how to limit car-borne shopping. These policies make it harder to develop new retail warehouse schemes in the UK, and thus restrain supply.