Abstract
A number of pre-lets result in an active first quarter for the City
A number of pre-lets result in an active first quarter for the City
Supply and demand snapshot
■ As a result of five pre-lets in March, take-up for the month reached 783,897 sq ft across 36 transactions, with an average deal size of 21,774 sq ft.
■ This brings total take-up for 2018 to 1.4m sq ft, which is 8% down on this point last year, but 7.5% up on the 10-year average for the first quarter of the year. The 12-month rolling take-up fell to 7.2m sq ft, which is still 27% up on this point last year.
.png)
TABLE 1 | Key March stats
Source: Savills Research
■ A notable transaction to complete in March saw Sidley Austin pre-let levels 12 - 20 (133,776 sq ft) at TH Real Estate's new development 70 St Mary Axe, EC3. The international law firm will be moving their entire operations from their current residence at Woolgate Exchange, EC2 after the scheme achieves completion in Q1 2019.
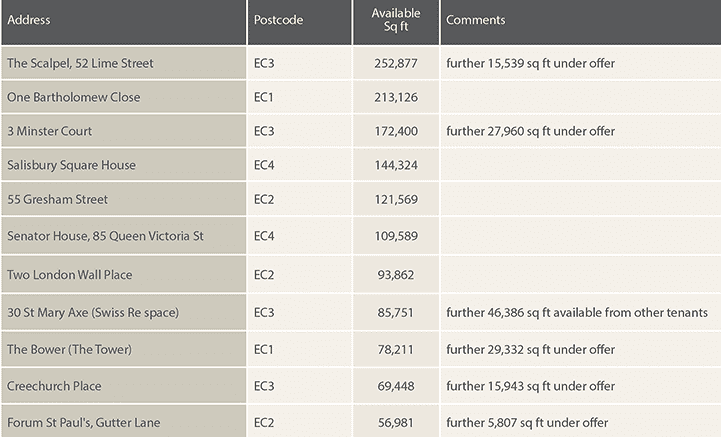
■ Also in March, Charles Taylor Plc signed on 70,591 sq ft across the upper ground, ground and first floors on a 20-year lease at a rent of £57.50/sq ft. The insurance company will be consolidating from various offices including Lloyds Chambers, 1 Portsoken Street, E1. There is still 172,400 sq ft of available space in 3 Minster Court, EC3 across levels 2–8.
■ So far this year, we have seen good levels of demand from the Insurance and Financial services and the Professional services sectors, who have accounted for 32% and 20% respectively. However, the Serviced Office Provider sector has been quiet, accounting for just 4%.
■ The Tech & Media sector have continued to take space, accounting for 14% of Q1 take-up. Interestingly, 70% of the 197,000 sq ft let by this sector was taken in the City core, as opposed to their traditionally favoured northern and eastern fringe market.
.png)
GRAPH 1 | City take-up by quarter
Source: Savills Research
■ Total City supply stands at 7.5m sq ft at the end of Q1, equating to a vacancy rate of 5.9%, which is up on this point last year by 40bps, but down on the 10-year average by 70 bps.
■ Following 200,000 sq ft going under-offer in March alone, there is currently 1.4m sq ft under-offer in the City.
■ The average prime rent for Q1 is £79.79/sq ft, which is up on the prime rent for Q4 2017 by 2.3%. This has been partly aided by the top rent of £94.00/sq ft being achieved when Jellyfish acquired part level 28 (9,752 sq ft) at The Shard, SE1.
■ The differential between the average Grade A rent of the City core and the City fringe has increased to £3.65/sq ft. This is due to the City core rising to £62.50/sq ft for Q1, while the fringe fell to £58.85/sq ft.
.png)
GRAPH 2 | City rents
Source: Savills Research
■ The average months rent free on a 10-year lease in the City remains at 23.
■ As a result of good pre-letting activity, the development pipeline is now 30% pre-let from now until the end of 2021. This will assist in keeping the vacancy rate low, and countering a potential dip in take-up over the next two years as the market moves through the cycle.
.jpg)
TABLE 2 | Monthly take-up
.png)
TABLE 3 | Year to date take-up
.png)
TABLE 4 | Rents
.png)
TABLE 5 | Supply
Demand figures include central London requirements
.png)
TABLE 6 | Development pipeline
Completions due in the next six months are included in the supply figures
* Average prime rents for preceding three months
** Average rent free on leases of 10 years for preceding three months
.png)
TABLE 7 | Demand & Under Offers
.png)
TABLE 8 | Significant March transactions

TABLE 9 | Significant supply
.jpg)
MAP 1 | Savills City office market area (updated at the end of each quarter)
City 2018 Q1 stats