Research article

Consumer insights

We examine the nature of local shopping trips


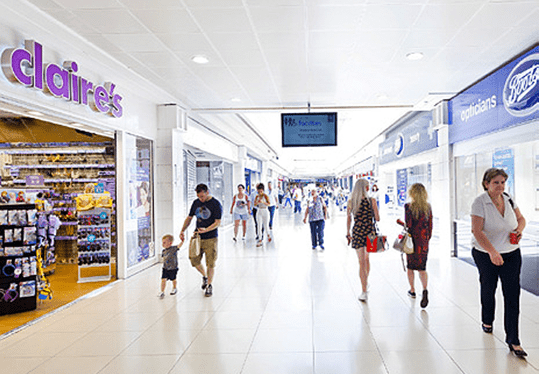
Shoppers of all ages and demographics across the UK are using local shopping centres to fulfil a wide range of retail and service needs, including more than just grocery goods.

Analysis of our latest survey into the nature of these local shopping trips has provided several insights into the importance of this sector. The national exit survey of 7,800 shoppers, undertaken across Ellandi’s Community shopping centre portfolio, gives us an accurate account of what is driving these visits.

Local shopping centres often gain more regular visitation from the communities they serve than larger retail destinations. Yet dwell times and basket spend are surprisingly high.

Furthermore, there is increasing evidence that community shopping places can co-exist more readily with ecommerce than larger comparison shopping retail destinations. This is because local shopping centres can provide a key point of difference in the ‘here-and-now’ consumer culture we have grown accustomed to, in terms of availability, convenience, accessibility, service and price point.

Travel, frequency and dwell

The key distinction of functional, convenient retail places is that they serve a local population, with journey times being short. Travel time of less than 10 minutes was recorded for 46% of shoppers in Ellandi’s shopper survey, with 79% of journeys less than 20 minutes.

Figure 2

FIGURE 2Travel time and dwell time

Source: Savills Research / Ellandi

Frequency of visit is high, with 78% of shoppers visiting the shopping centres at least once a week and 92% visiting at least once a month; this is in line with visitation to other Community shopping centres. The Midlands, North East and North West regions have the most frequent visitation, with over 80% visiting at least once a week.

By contrast, large regional shopping centres have much lower shopper frequency, with only c.15% visiting weekly and 44% of visitors coming less than twice a year. Retail parks draw 19% of shoppers weekly and high streets 53% weekly.

The difference in visitation between different types of retail schemes is closely linked to the nature of the retail journeys they support. A local offer may typically be expected to provide a high proportion of groceries, retail services and other staple goods that shoppers require more often, as opposed to a ‘destination’ retail scheme providing a higher proportion of comparison and fashion goods, and a more comprehensive leisure offer.

Figure 3

FIGURE 3Shopping frequency by retail place type

Source: Savills Research / Ellandi

However, if the relationship was simply a matter of ‘convenience’ then we could anticipate short shopping duration. Instead, dwell times are far longer than might be expected, with 44% of trips longer than one hour and only 30% less than 30 minutes. Northern Ireland shoppers had the largest proportion of trips being longer than one hour (66%), followed by Greater London (51%).

While longer travel times (and therefore effort) results in increased dwell times, there appears to be no consequent impact on frequency of visit.

Local competition does play a factor in shopper dwell times, as they are longest in locations where the shopping centre is the dominant scheme in the town, or where additional town provision is smaller.

There was no demographic bias in frequency of visit or dwell times across the schemes we analysed, and they were broadly similar across all affluence and age bands.

The conclusion is that these community-based locations have frequent visits and short travel times. The surprise is in the length of duration of shopping trips for these regular visits.

How much are people spending?

Further indication that Community shopping centres provide an important functional shopping experience, can be seen in the conversion rates and spend profiles.

Basket spend is higher than expected, averaging £36.60 per visit, 56% of trips are purpose driven and 78% of people are spending when they visit.

Figure 4

FIGURE 4Visitation & spend highlight

Source: Savills Research / Ellandi

Analysis of shopper demographics shows very little difference in spend between different socio-economic groups.

The exception is the least affluent group “Urban Adversity”, which accounts for 24% of shoppers across all schemes analysed. However, with an average spend of £26 and weekly visitation of 76%, this group still accounts for a considerable volume of total spend.

The similar spend profile across the demographic groups demonstrates the nature of shopping trips in these locations. These are functional shopping journeys based on necessity rather than indulgence.

This necessity is shown through the spend profile of the different generations. Generation Z (born post 1995), who are typically only shopping for themselves and may still live at home have the lowest average grocery spend (£9).

Generation X with more mouths to feed than other groups, have over £5 more spend than average on both grocery (£30) and non-food goods (£38).

Figure 5

FIGURE 5Basket spend by generation

Source: Savills Research / Ellandi

Shoppers are spending more on non-grocery goods (£34), than food-grocery (£26), yet given that ‘convenience’ is cited at the main reason to visit it is clear that consumers think of Convenience Goods as more than just supermarket shopping. With an average catering spend of £7.50, F&B demand is associated with the need for a coffee, or snack rather than a restaurant meal. The F&B in this context is therefore also driven by convenience.

The notion of convenience implies a quick ‘in-out’ shopping experience, yet dwell times are surprisingly long and there is strong evidence that in Community shopping centres, longer visits supported by a diverse offer results in higher spend; average spend increases to £78 on visits over two hours. While this might seem obvious, it is indicative that convenience trips are not always short and people are visiting with an intent to spend money rather than just as a means of spending their time.

Increasing dwell beyond 30 minutes does not appear to result in higher grocery spend within an hour, but doubles with visits of more than two hours. The main beneficiary of longer shopping trips is to other non-grocery retail stores, as spend doubles over one hour and quadruples over two hours. While a longer visit increases the likelihood of spending on F&B, the average spend remains below £10. This means that even when dwell is increased there is little demand for visiting a restaurant.

Figure 6

FIGURE 6Link between basket spend and dwell time

Source: Savills Research / Ellandi

These insights are counter to the often held view that Secondary retail places lack relevance. Community schemes have high conversion rates, visitation and an average spend of over £36, these schemes have the potential to draw a considerable amount of catchment spend.

What are people buying?

Convenience is by far the primary reason that shoppers visit Community shopping centres, with 65% stating this as a key driver. This explains the short travel times observed, frequency of visit and the importance of grocery purchases that are made in 46% of visits.

Figure 7

FIGURE 7What has been purchased?

Source: Savills Research / Ellandi

The range of shops on offer is also a key reason people choose to visit a centre and has a direct influence on dwell time. For people shopping less than 30 minutes the range of stores was only considered important to 28% of shoppers, but this increased to 43% for shoppers dwelling for more than two hours.

This demonstrates that a diverse offer can help to extend shopper visits. The range of goods purchased reinforces that Convenience shopping is much more than just making a grocery trip.

Household, Fashion, Discount and Health & Beauty goods are all purchased during more than 20% of shopping trips. Gifts & Cards sector are purchased 13% of visits.

Many non-grocery brands, particularly those with an affordable price point, fit well within a convenience shopper journey, particularly where they provide a functional offer that fits necessity rather than indulgence; hence the range of Value/Discount retailers being cited as a reason to visit by 20% of shoppers.

Increasing dwell times from 30 minutes to two hours broadly doubles the likelihood that a shopper will purchase from a particular goods sector. However, shoppers are three times more likely to make a fashion purchase over a two-hour trip than a half hour trip, and four times more likely to make an F&B purchase.

The F&B offer is particularly important to Generation Z shoppers, who are likely to be visiting for social reasons as much as shopping, with over a third of these shoppers making an F&B purchase.

Figure 8

FIGURE 8What the Generations shop for

Source: Savills Research / Ellandi

Customer satisfaction is good, with 65% rating the experience 8-10 and 95% finding everything they wanted to buy. The key reasons for a positive experience are due to retail line up and environment/ experience. These factors are important to shoppers despite the functional nature of their visit and increase in importance for shoppers with longer dwell times.

Figure 9

FIGURE 9Reason for visit by dwell

Source: Savills Research / Ellandi

One question the analysis sought to address is whether the risk of impact from ecommerce is less of a threat to local shopping centres. Given the importance of convenience, value, availability and price point as fundamental drivers within these retail places, it is less vulnerable to the growth in online shopping than may have been anticipated.

The visitation rates of different generations of consumer to the Community shopping centres sits between 75–85% weekly visits, with monthly visits of 91–95%. By comparison, online usage varies significantly between the generations, and even amongst the most online savvy group, Generation Y, only 40% make an online purchase every week.

Figure 10

FIGURE 10Frequency of shopping centre and online visitation of the different Generations

Source: Savills Research / Ellandi

On average, across all Generations, only 40% of shoppers surveyed make a monthly online purchase; the same as proportion as visit a regional mall. Furthermore, 40% of those surveyed don’t shop online at all.

This highlights the importance of local centres in regularly engaging with consumers and their frequent retailing needs via an offline retail experience. The responses from the consumer survey indicate that online and local shopping schemes are more complimentary to their overall retailing needs than a directly competing offer.


Exactly how do the different Generations shop in local shopping centres

Consumer insights

Other articles within this publication

4 other article(s) in this publication