Research article

Forest values remain diverse

2016 proved to be an average year for UK forestry, in terms of transactions and values

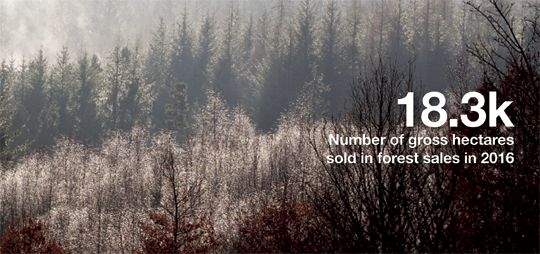
Just over 18,300 hectares of forestry were sold across Great Britain during the 2016 forest year (1 October 2015 to 30 September 2016).

Although this is significantly lower than the volume sold in 2015 (23,000 hectares), 2015 was an exceptional year, and as reported in our 2016 UK Spotlight report, a third of all the sales during 2015 related to forestry portfolios, which are not regular features of the market.

In spite of this, our research shows the area sold in 2016 is still 2% higher than the average of the previous six years and 14% higher than in 2014.

Had there been ‘normal market conditions’ during 2015, the volumes transacted during 2016 would have been higher than 2015 (Figure 1).

Figure 1

FIGURE 1Total market area and value

Source: Scottish Woodlands and Savills Research

The proportion of forestry sold in North Scotland during 2016 doubled compared to 2015 (see Figure 2). This increase relates to two large sales; The Barracks and Strathmore Forests, which at a total of 7,246 hectares made up 97% of the total area sold in North Scotland during 2016, or 40% of the wider UK market.

There was a slight increase in the proportion of sales in both Central Scotland and England and Wales. In South Scotland, the proportion of forestry sold during 2016 fell to 12% which is significantly lower than the medium term average of 33%.

Figure 2

FIGURE 2% market area by region

Source: Scottish Woodlands and Savills Research

Total market value

The total value of the forestry investment market contracted in 2016 to just over £82.6 million, due to the smaller traded volume and the effect of regional variations.

If we overlook 2015 and compare 2014 and 2016 alone, the difference in the volume of forestry sold increased by 14% between 2014 and the 2016 forestry years.

However, the total value of the forestry market was just half a percent higher than the value of 2014’s forestry transactions.

This imbalance between volume and value reflects the large sales in North Scotland, which represented 40% of the market by area traded but only 16% by value.

Average values

The relationship between the value of the total (gross) forest area and the productive area (land stocked with trees capable of producing an end crop of timber) is an important measure when appraising investment forests. The area of unplanted or unproductive land can vary considerably, from as little as 5% to as much as 50% of a property.

The unproductive area has a relatively low and fairly constant value, therefore the market price, and ultimately the investment performance, is driven by the value of the productive area.

In 2016, the overall average productive value showed a marginal fall of -3% to £8,100 per hectare. The productive value was 31% higher than the average gross value at £6,200 per hectare. Gross values recorded an -8% reduction per hectare.

The recorded fall in average values is not a market indicator of reducing prices but simply due to the large proportion of lower value sales in North Scotland.

Analysis of the annualised rate of value growth over the past five years (2011–16) shows growth in values was stronger for productive values (11%) than for the gross forest area (10%).

Regional performance

As reported in our 2016 ‘Spotlight on the Forestry Market’ publication, average forestry values are diverse and the actual price paid is generally dictated by the location, quality, access, timber species and plantation age.

Our regional analysis focuses on four key regions; North, Central and South Scotland, and England & Wales. Figure 4 illustrates how the average productive price varies by region.

Over the past five years, South Scotland has always achieved the highest average capital values, reflecting the prime timber growing characteristics of this region.

During 2016 average values in England and Wales were higher than South Scotland with the average price rising by 26% to £11,600 per hectare.

Values in England and Wales were driven by a lack of investment property and therefore strong prices were paid for any opportunities that came to the market. South Scotland recorded a rise of 12% in average prices paid.

As previously highlighted, in North Scotland the area of forestry sold increased, but the average price per hectare fell.

Average prices in Central Scotland have shown the most variation over the last five years, but this reflects the wide range of land types and wide variability in forest quality across this area.

Although the average price here dipped in 2016, better quality spruce dominated properties rose in value, especially in parts of Argyll and Aberdeenshire, benefitting from improvements to regional timber marketing.

England and Wales enjoyed the highest (18%) regional annualised rate of value growth over the past five years (2011–16), followed by South Scotland at 10%. North (8%) and Central Scotland (3%) recorded the lowest growth rate (Figure 3).

Figure 3

FIGURE 3Five-year annualised rate of capital growth to 2016 by region

Source: Scottish Woodlands and Savills Research

Age and value

There is a direct correlation between forest age and value with clear regional profiles. Although all regions show growth in mature forest values, South Scotland continues to show the fastest rate of annual growth.

England and Wales have shown an increase in mature forest values. North Scotland remains the lowest value region where the valuation curve has flattened since 2015 indicating little inflation in plantation values.

Figure 4

FIGURE 4Regional forestry transactions and values

Source: Scottish Woodlands and Savills Research

Other articles within this publication

3 other article(s) in this publication