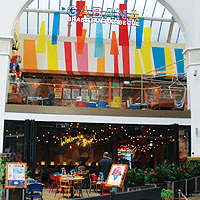
There are over 56,000 restaurants in the UK, of which fewer than 10% are branded casual dining locations. Additionally, there are 100,000 pubs, takeaways and cafés, each vying for a share of the elusive consumer pound. Yet consumers have proven increasingly willing to spend on eating out of the home at the same time as they have tightened their belts with regards to grocery and comparison goods shopping.
The dining out market has recovered well from the economic turmoil of the last eight years. Restaurant spend has increased in all regions in the last five years, with the Southwest and Yorkshire/Humber expanding most significantly with spend on dining out estimated to be £580 more per household than five years ago.
Economically things have been in a good place for the restaurant sector, with rising incomes, growing employment and low interest rates. Clearly a rise in the latter would have a direct impact on many mortgage bound households and their disposable income, but the wider economic benefits that would support such a rate rise must be good for the sector.
The next five years are expected to see household spend growth slow and the longer trend shows that we are still spending less on eating out than we were back in 2008. It will be another decade before household restaurant spend is expected to be at pre-recession levels. This is with the exception of Northeast, Wales, Southwest and Northern Ireland regions, where spend already exceeds 2008 levels.
Even London, the leader for dining out culture in the UK, is not expected to reach 2008 household spend levels until after 2026.
However, the total pool of available consumer restaurant spend surpassed pre-recession levels in 2015 to over £81bn and will exceed £85bn by 2020 and £91bn by 2026 (Pitney Bowes). Clearly then, while household restaurant spend levels growth is slowing, overall market capacity is growing rapidly.
Perhaps more critical with regards to casual dining/branded restaurants, is that this sector accounts for only a modest proportion of the overall market. According to Horizons, branded restaurants account for 7% of the overall eating and drinking market. This is equivalent to a market size of around £5.9bn in 2015, from a total pool of £81bn in consumer spend.
While proportionately small in terms of the overall eating and drinking market, the potential for expanding the branded restaurant market is significant, because it only needs to see a small gain in market share to see a vast increase in trade. CGA Peach Brand Tracker suggests that visitation to small restaurant brands has doubled since 2013, in what appears to have been largely diverted from quick service restaurants and take-away establishments.
Increasing specific casual dining spend at the household level is therefore less about increasing eating out spend and more closely aligned with changing the kind of places that people choose to eat out in. To this end the rising casual dining market is linked to a shift in attitudes away from a drink-led culture towards a higher quality, yet informal dining experience.
.png)


.png)