.jpg)
For the second consecutive month, the Lisbon office market has suffered a fall in business activity.
These results are not surprising at all and they reflect the forecasts released in the end of 2018.
Rodrigo Canas
In the month of February 2019, the office Market in Lisbon noted a downtrend in the in the take up. The decrease of 39% compared to the same month in 2018 and decrease of 45% since January does not raise doubts and shows how difficult it will be for the market to respond to the demand for new office spaces which remains very high.
Rodrigo Canas, the Director of the Agency Department at Savills Portugal states “These results are not surprising at all and they reflect the forecasts released in the end of 2018. Finding legitimate solutions for office occupation at a timing required by firms will be one of the greatest challenges of 2019, without dismissing from mind the fact that the scarce supply has limited the choice of infrastructures when it comes to their quality. It is also important to note that other trends for 2019 will be renegotiation processes to answer the lack of supply in the market”.
.png)
GRAPH 1 | Take-up February 2018 vs. February 2019 (sq.m)
Source: Savills Research/LPI
Along February 2019 there were 9 operations recorded, a reduction of 31% in the number of transactions for the same month in 2019, corresponding to 4 transactions, a downtrend of 31%.
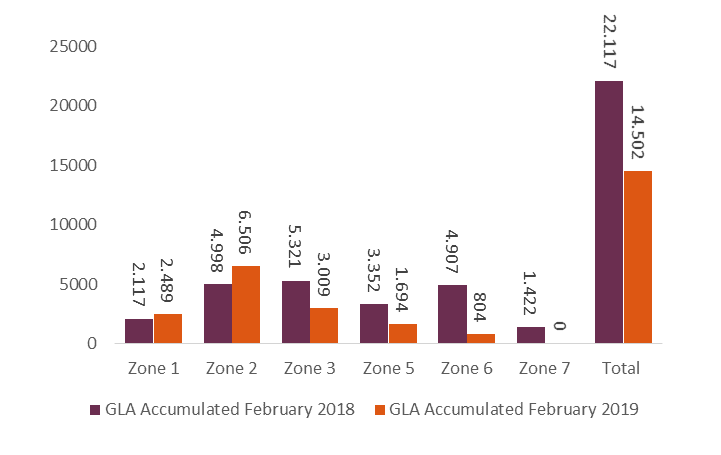
In cumulative terms, the take up registered in the first two months of 2019 had 34% less area than that of the same time period for 2018, while the number of transitions also reduced, by about 32%.

GRAPH 2 | Accumulated Take-up (sq.m.) | February 2018 vs February 2019
Source: Savills Research/LPI
In the analysis of the accumulated take up per market zone, there is an exception for Zone 1 (Prime CBD) and Zone 2 (CBD) which registered an increase of 17.5% and 30% respectively in the take up, while the other zones observed decreased activity.
Despite the lack of supply, which is mostly expressed in central zones (Prime CBD and CBD, the results released for the first two months of the year show the preferences of firms for central zones, where there is a complete network of services, in an environment filled with services and the possibility to connect to an entrepreneurial ecosystem of technology and innovation.
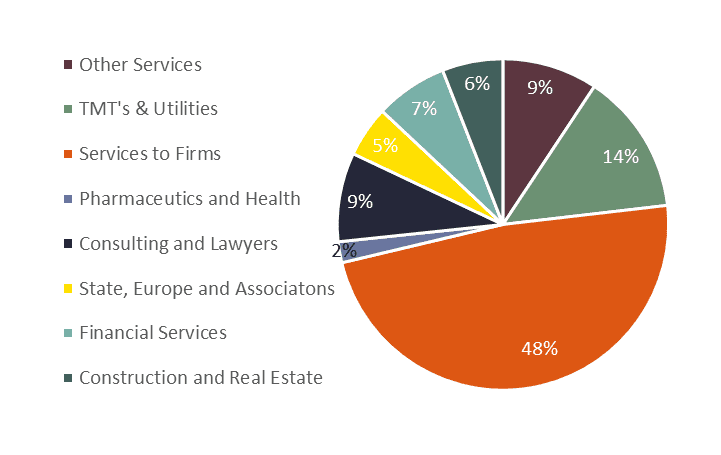
The sector of Activity Services to Firms was undoubtedly the most active sector for the past two months, accounting for 48% off the total volume of contracted area (6,980 sq.m), followed by the TMT’s and Utilities sector with 14% (2,007 sq.m).

GRAPH 3 | Destribution of the Take-up by Sector of Activity | Accumulated February 2019
Source: Savills Research/LPI
